 Stay
Stay 

Trading Conditions
Products
Tools


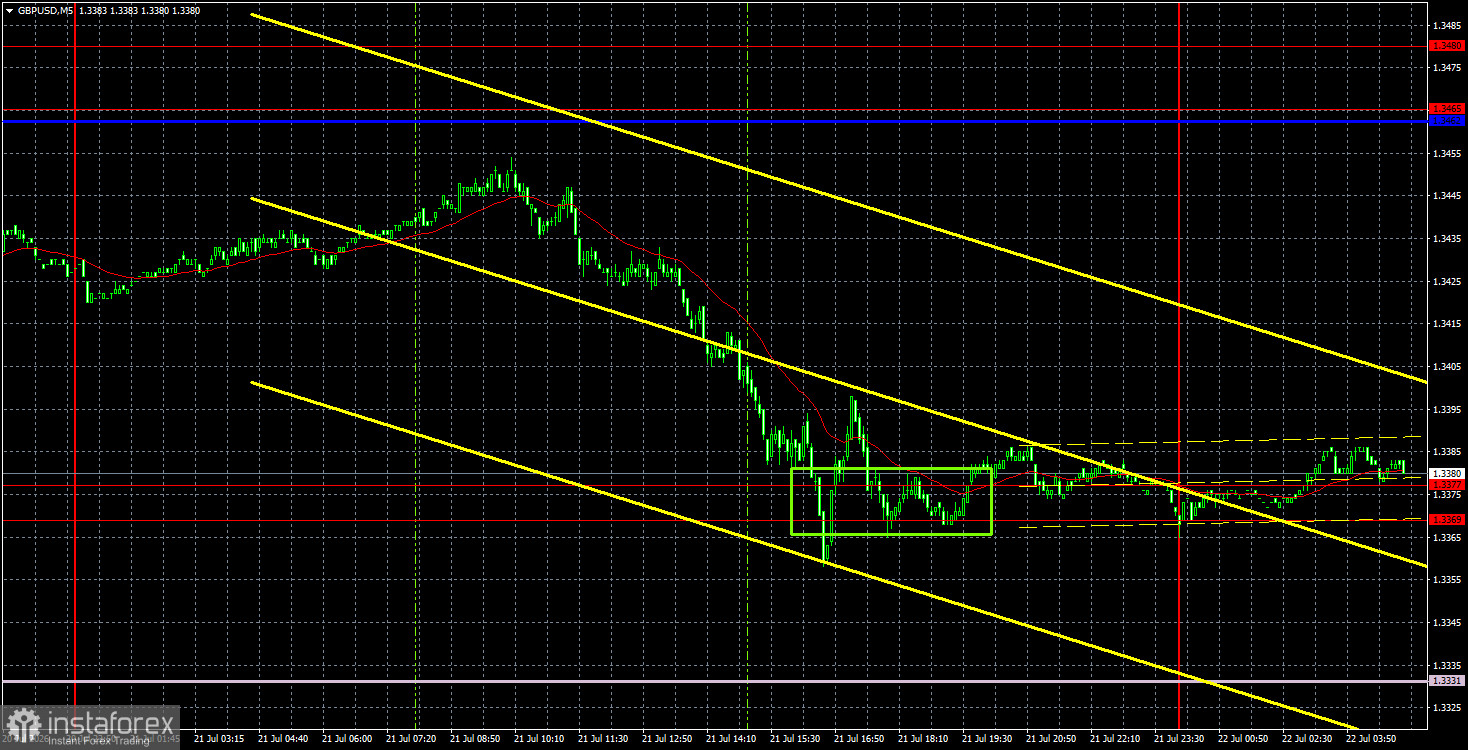
The GBP/USD currency pair continued its downward movement on Tuesday, negating all of the previous week's gains. The current decline of the British pound has the same technical nature as the preceding increase. Essentially, we continue to observe a flat on the weekly timeframe, and movements within the flat are often random. Yesterday, there were quite decent reports on unemployment and wages published in the UK. At least the unemployment rate did not rise as most traders expected, and the number of unemployed increased much less than forecasted. Therefore, the British pound could have ended yesterday in positive territory. However, the market continues to ignore most macroeconomic data, responding only to the most significant reports. We expect predominantly technical movements going forward. For example, after the current downward correction is completed, a resumption of growth for the British currency can be anticipated.
From a technical perspective, the British pound has begun a new downward trend on the hourly timeframe, which is likely a correction against the upward trend on the 4-hour timeframe. The trend line supports the bears, but a consolidation above it would indicate a trend reversal. Additionally, the price is located below the lines of the Ichimoku indicator, which also indicates a downward trend.
On the 5-minute timeframe on Tuesday, only one trading signal was formed. However, the day prior, the price bounced off the area of 1.3465-1.3480, so short positions could have been carried over from Monday to Tuesday. On Tuesday, the pair worked through the area of 1.3369-1.3377, making long positions more relevant this morning.
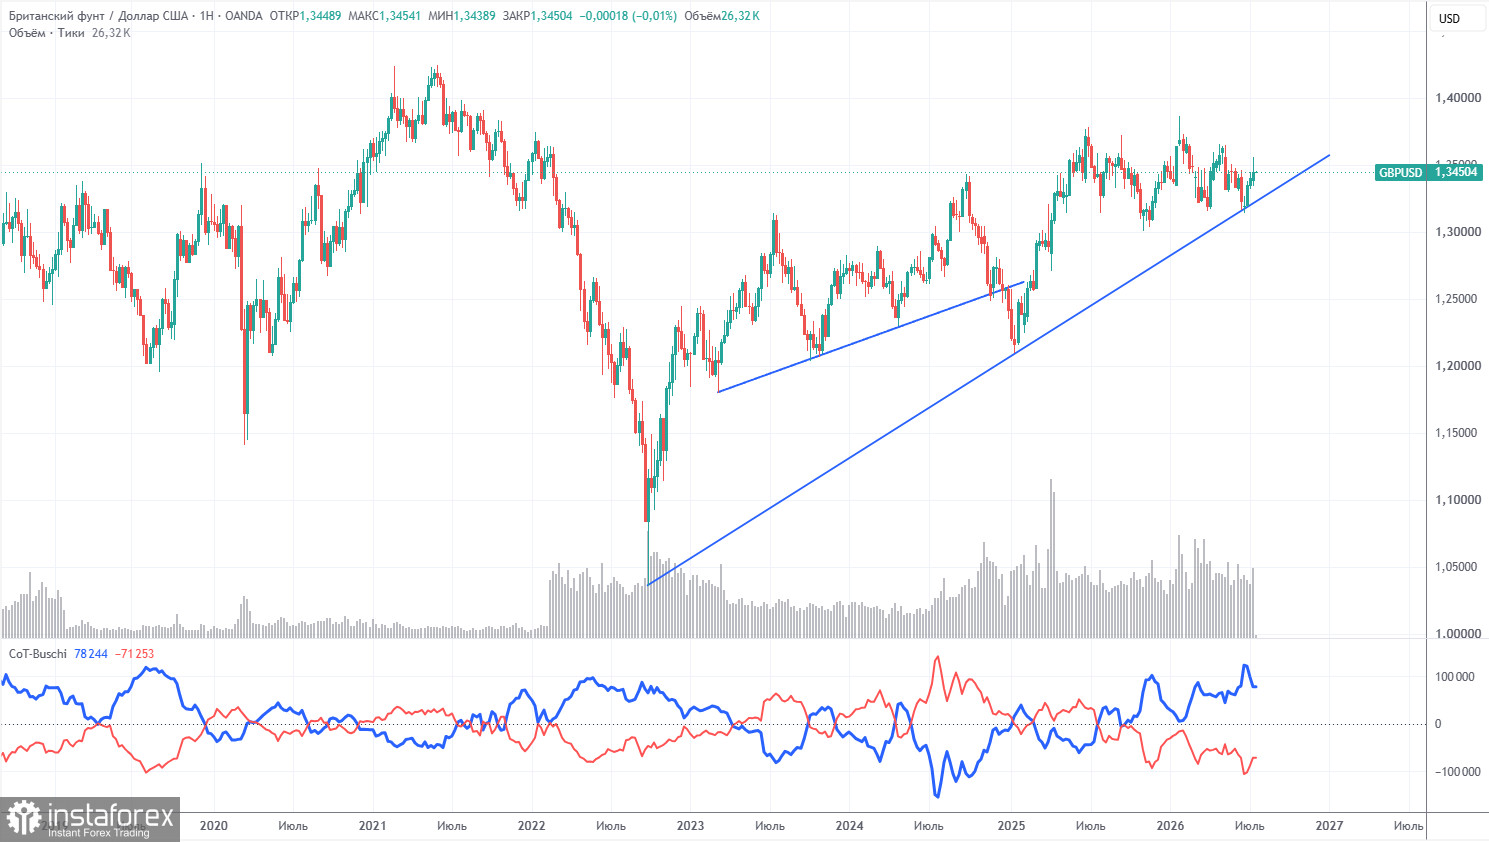
COT reports for the British pound indicate that non-commercial traders have dominated the market with sales for several consecutive months. The net position is negative despite the retention of an upward trend in the long term. Considering events in the Middle East, it is not surprising that demand for risk currencies remains weak. The war is formally over, but the conflict persists. Geopolitics may support demand for the US dollar in the near future. However, until a consolidation below the trend line occurs, we would not expect a strong decline in the pair.
In the long term, the dollar is expected to continue declining due to Donald Trump's policies, as can be clearly seen on the weekly timeframe (illustration above). The trade war will continue in one form or another for a long time, and Trump's policies are directly and indirectly aimed at weakening the American currency. The long-term upward trend remains, as evidenced by the trend line. The price recently tested this line and bounced off it. According to the latest COT report (dated July 14), the "Non-commercial" group opened 6,500 BUY contracts and closed 10,100 SELL contracts. Thus, the net position of non-commercial traders increased by 16,600 contracts over the week, which in no way affects the overall sentiment of professional players.
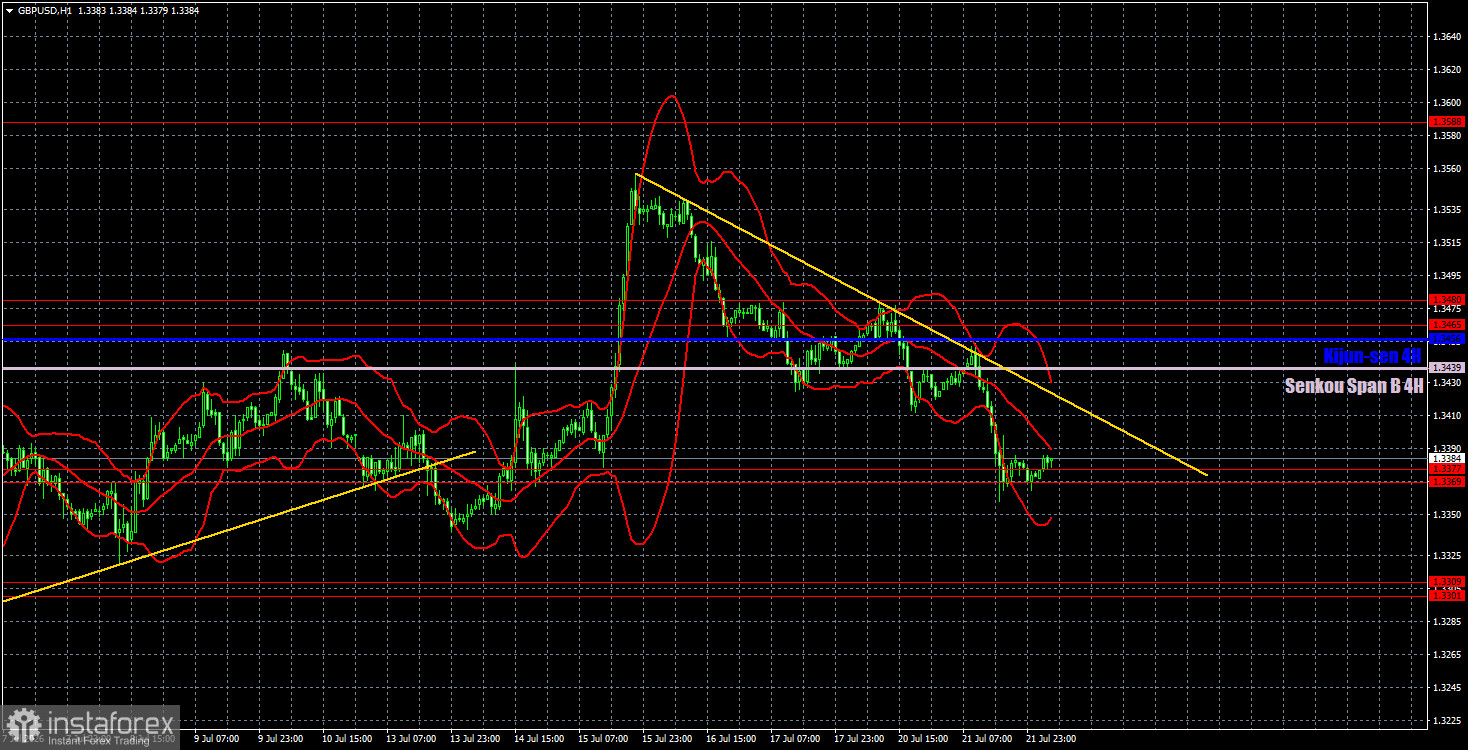
On the hourly timeframe, the GBP/USD pair continues to correct after three weeks of growth. The market continues to ignore geopolitics, and in recent weeks we have observed technical growth fueled by weak inflation data in the US. After the current correction is completed, it is quite possible to expect a resumption of growth for the British currency based on the pair movements within the horizontal channel on the weekly timeframe.
For July 22, we highlight the following important levels: 1.3042-1.3050, 1.3096-1.3115, 1.3179-1.3187, 1.3301-1.3309, 1.3369-1.3377, 1.3465-1.3480, 1.3588, and 1.3671-1.3681. The Senkou Span B (1.3439) and Kijun-sen (1.3456) lines may also serve as sources of signals. It is recommended to set the Stop Loss to breakeven after the price moves in the right direction by 20 pips. The lines of the Ichimoku indicator may move throughout the day, which should be taken into account when determining trading signals.
On Wednesday, an important inflation report for June will be released in the UK, which will largely determine the Bank of England's stance for the next two meetings. Currently, there is no talk of raising the key rate, and June's inflation may decrease even further. Most likely, the market has already factored in the slowing inflation and decreasing hawkish expectations regarding the BOE.
Today, traders may open new short positions targeting the area of 1.3301-1.3309 if the price consolidates below the area of 1.3369-1.3377. Long positions can be opened if there is a bounce from the area of 1.3369-1.3377, targeting the Senkou Span B and Kijun-sen lines.
Price levels of support and resistance are thick red lines around which the movement may end. They are not sources of trading signals.
The Kijun-sen and Senkou Span B lines are Ichimoku indicator lines transferred to the hourly timeframe from the 4-hour timeframe. They are strong lines.
Extreme levels are thin red lines from which the price has previously bounced. They are sources of trading signals.
Yellow lines are trend lines, trend channels, and any other technical patterns.
Indicator 1 on the COT charts represents the size of the net position of each category of traders.
InstaForex analytical reviews will make you fully aware of market trends! Being an InstaForex client, you are provided with a large number of free services for efficient trading.


