 Stay
Stay 

Trading Conditions
Products
Tools


"Rome wasn't built in a day" — this simple wisdom unexpectedly captures the Dow Jones Industrial Average's recent behavior. The blue-chip index didn't rush to the top in a single bound but methodically, session by session, pecked its way to new highs: five consecutive days of gains, the 24th record this year, and a second straight session of more than 600-point gains—something that has happened only once before. On Wednesday, another round of strong earnings from Amgen, Walt Disney, and Merck lifted the index once again.
However, not all peers share the Dow's optimism. The S&P 500 closed in the red after hitting a record the previous day, while the tech-heavy Nasdaq 100 lost nearly 1%. The culprit was Alphabet, with shares tumbling by 4% following news of the departure of prominent AI veterans. The market reacts painfully to any signs that the artificial intelligence race may stall.
US Stock Index Performance
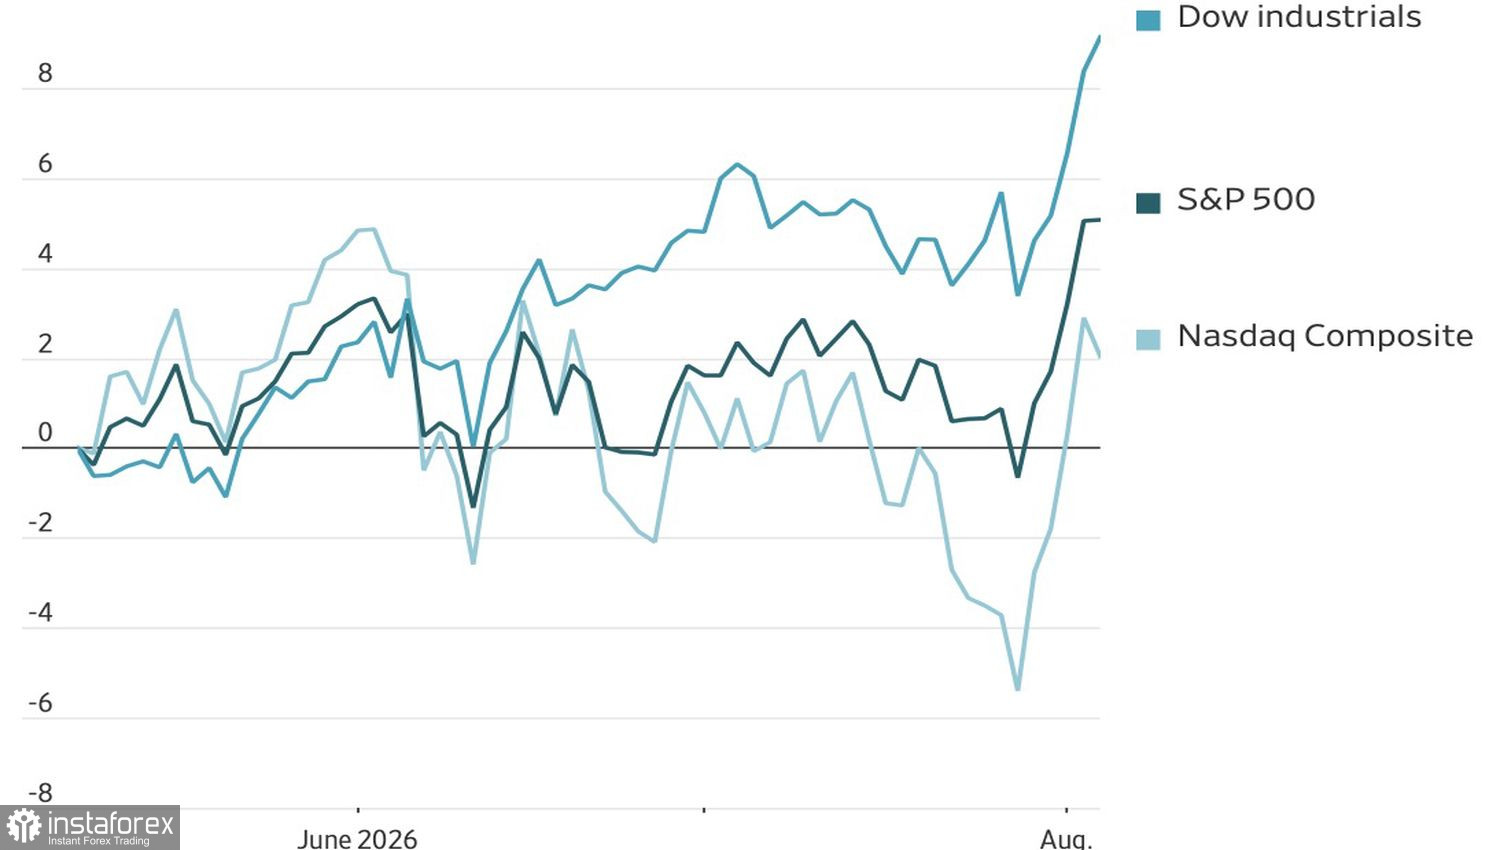
Nevertheless, earnings season continues to ease investor concerns about war, inflation, and the longevity of the AI boom. Signs of de-escalation in the Middle East conflict and falling oil prices have alleviated inflation concerns, pushing energy-sensitive industrial stocks higher—precisely the names that lifted the Dow.
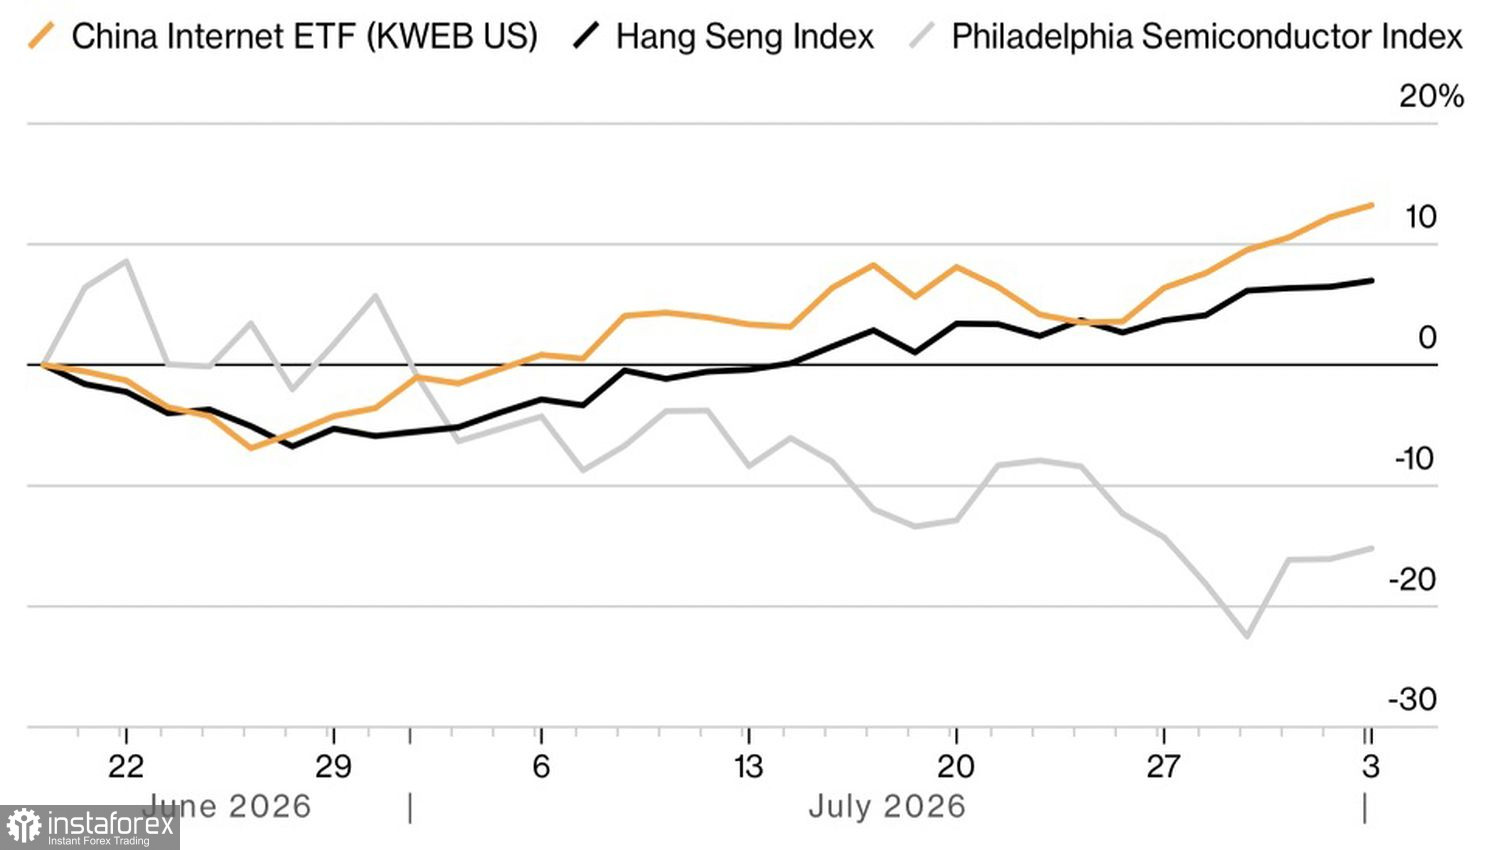
Nvidia gained 3.4% after Elon Musk announced that SpaceX would exclusively switch to its chips. Essentially, confidence in AI hyperscaling, fueled by Nvidia, Amazon, and Microsoft, is trickling down the AI food chain: hyperscalers are set to spend $800 billion on AI this year, and investors are increasingly betting not on chipmakers but on those monetizing ready-made services and applications. Not surprisingly, the KraneShares China Internet ETF has risen by over 20% from its June 25 low, twice the pace of the Hang Seng, while the Philadelphia Semiconductor Index SOX has lost about 11%.
Performance of KraneShares China Internet ETF, Hang Seng, and SOX
"Buy low, sell high" sounds appealing, but as this rally shows, far more money is made by buying expensive and selling even higher. Is the market ready to embrace this as its new rule of the game?
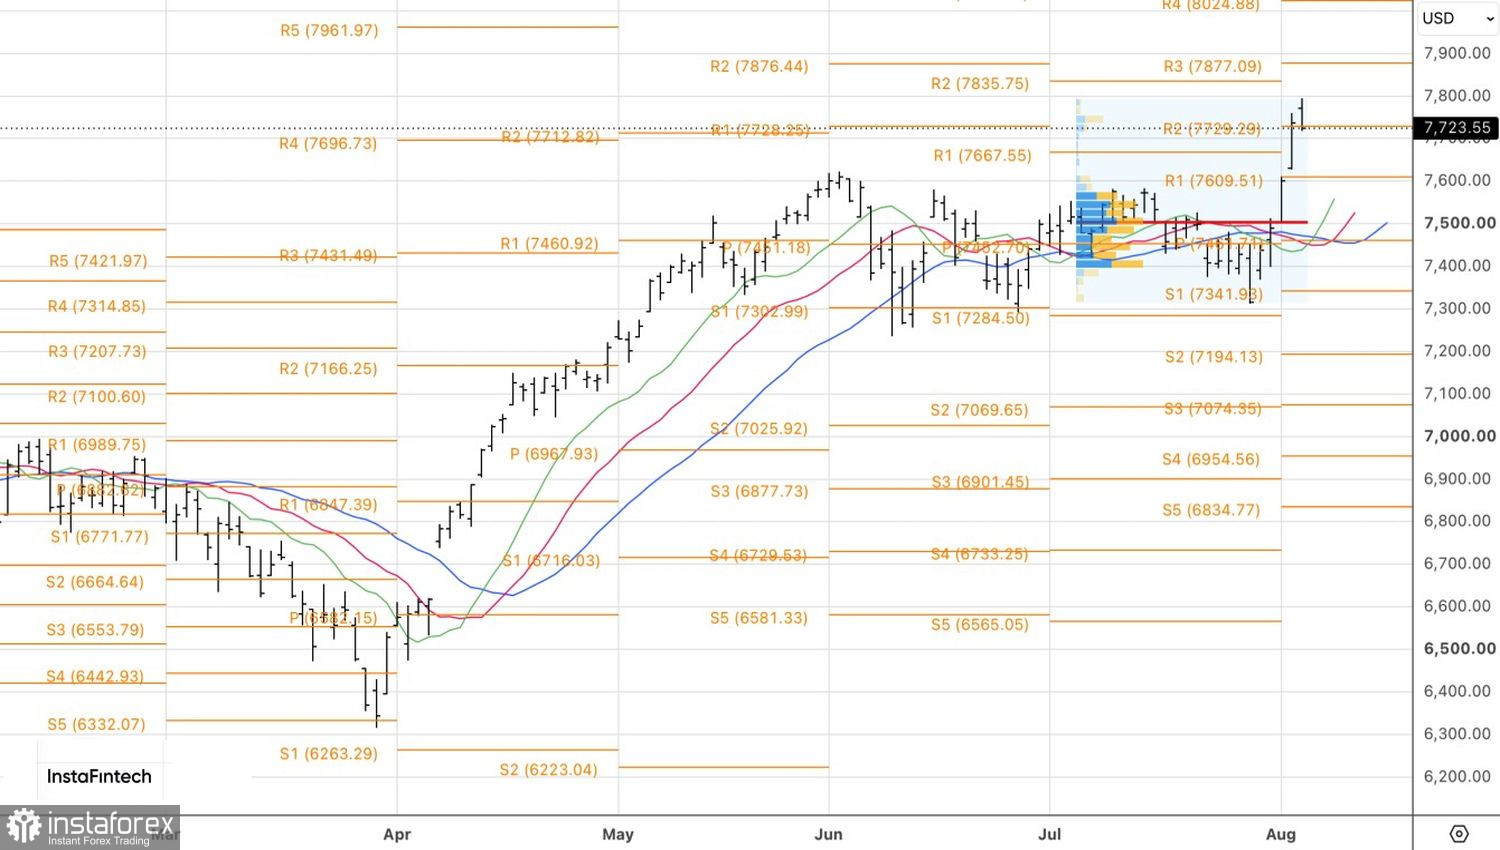
Technically, on the daily S&P 500 chart, a 20-80 pattern is forming. However, if the wide-body bar is not closed within two days, the upward move will likely continue. Purchases on pullbacks remain relevant, with a target at 8,000.
InstaForex analytical reviews will make you fully aware of market trends! Being an InstaForex client, you are provided with a large number of free services for efficient trading.


