 Stay
Stay 
Trading Conditions
Products
Tools



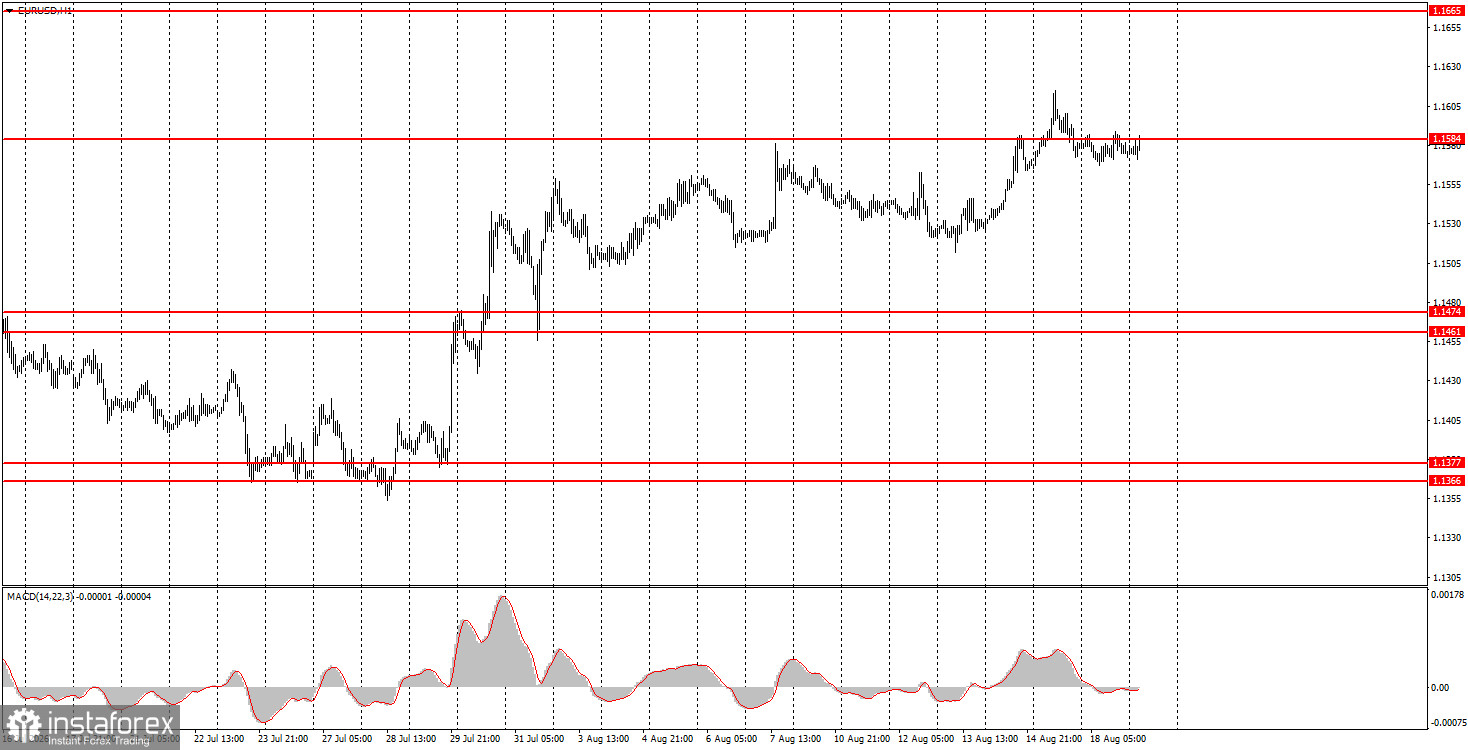
The EUR/USD currency pair showed no movement in trading on Tuesday. Volatility was around 20 pips, so from a technical standpoint, absolutely nothing changed. As we predicted, the market ignored all macroeconomic reports of the day: the ZEW economic sentiment indices for Germany and the Eurozone, U.S. construction market data, and the weekly ADP report. At this time, the market is focusing only on the most important events and publications, and none of the reports mentioned above fall into that category. Geopolitics also remains consistently negative. Negotiations between the U.S. and Iran are not taking place; Donald Trump has opted for a strategy of "waiting for Iran's economic collapse," and Iran has begun to threaten to breach the American blockade of the Strait of Hormuz, but saying and doing are two different things. Thus, there have been no significant changes in the fundamental or geopolitical backdrop this week, and the market has nothing to react to. The euro remains stable and holds good growth prospects.
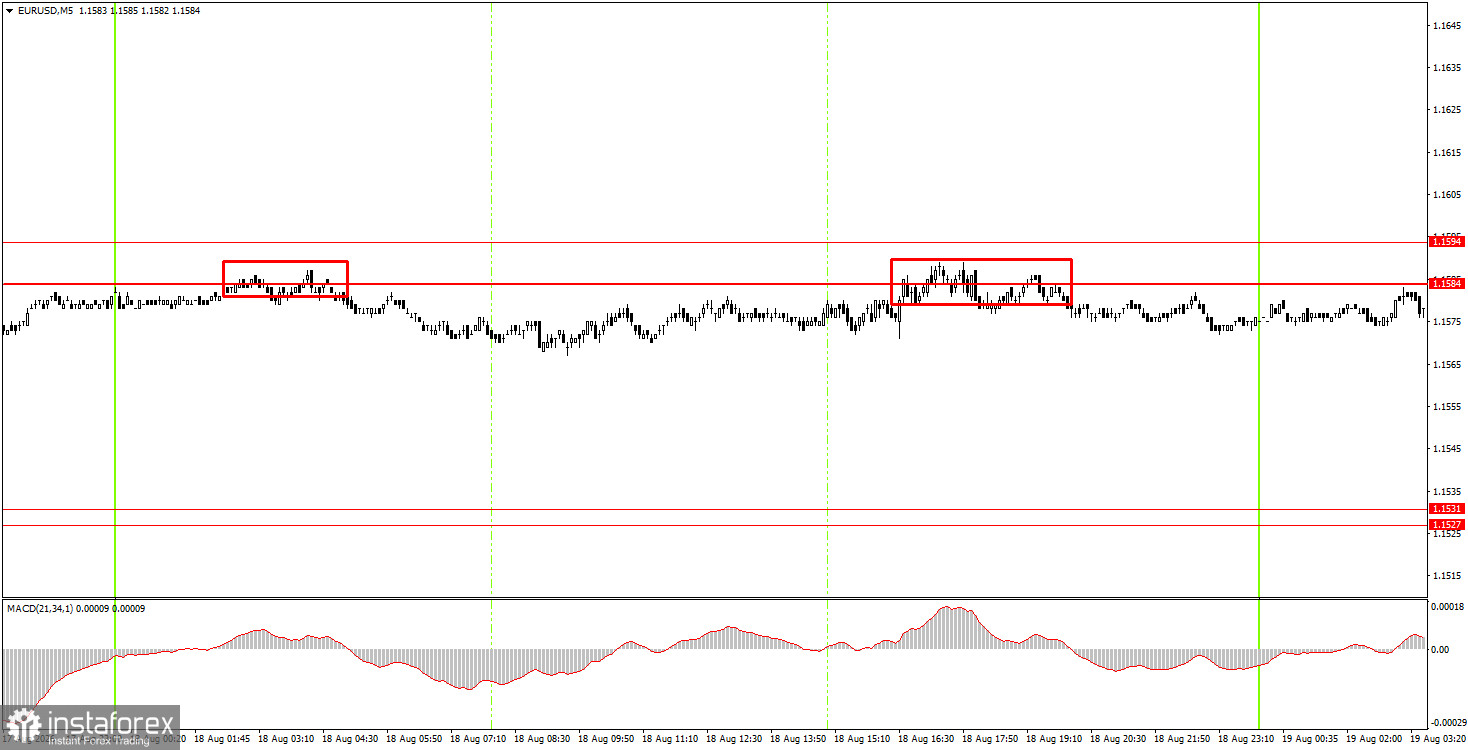
In the 5-minute timeframe, two sell trading signals were formally generated on Tuesday, but due to low volatility, no movement was observed in either case. Novice traders should remember that, in the absence of market movement, even with trading signals, it will be extremely difficult to achieve a profit.
On the hourly timeframe, the EUR/USD pair continues to form an upward trend. Considering all recent events, we believe the European currency should continue its confident growth even without local support. In recent months, the market has stubbornly ignored many factors in favor of the euro, so we continue to expect upward movement unless geopolitics interferes.
On Wednesday, novice traders may remain in short positions, targeting 1.1527-1.1531, as the price has consolidated below the 1.1584-1.1594 range and formed two sell signals yesterday. Long positions can be opened in the event of a breakout above the 1.1584-1.1594 range, targeting 1.1655-1.1665.
On the 5-minute timeframe, the following levels should be considered: 1.1267-1.1275, 1.1366-1.1377, 1.1461-1.1474, 1.1527-1.1531, 1.1584-1.1594, 1.1655-1.1665, and 1.1745-1.1754. On Wednesday, the Eurozone will publish the second estimate of July inflation, as well as a speech by Christine Lagarde, who may guide markets on whether to expect a monetary policy tightening in September. In the U.S., the Federal Reserve's minutes will be released today, a formal event.
Support and resistance price levels (areas) are the targets when opening buy or sell orders or sources of signals.
Red lines denote channels or trend lines that reflect the current trend and indicate in which direction trading is currently favored.
The MACD indicator (14,22,3) – histogram and signal line – is a supporting indicator that can also be used as a source of signals.
Important speeches and reports (as listed in the news calendar) can significantly influence the movement of the currency pair. Therefore, during their release, trading should be approached with utmost caution, or one should exit the market to avoid sharp price reversals against the preceding movement.
Beginners in Forex trading should remember that not every trade can be profitable. Developing a clear strategy and proper money management are essential for long-term trading success.
InstaForex analytical reviews will make you fully aware of market trends! Being an InstaForex client, you are provided with a large number of free services for efficient trading.


