 Stay
Stay 
Trading Conditions
Products
Tools



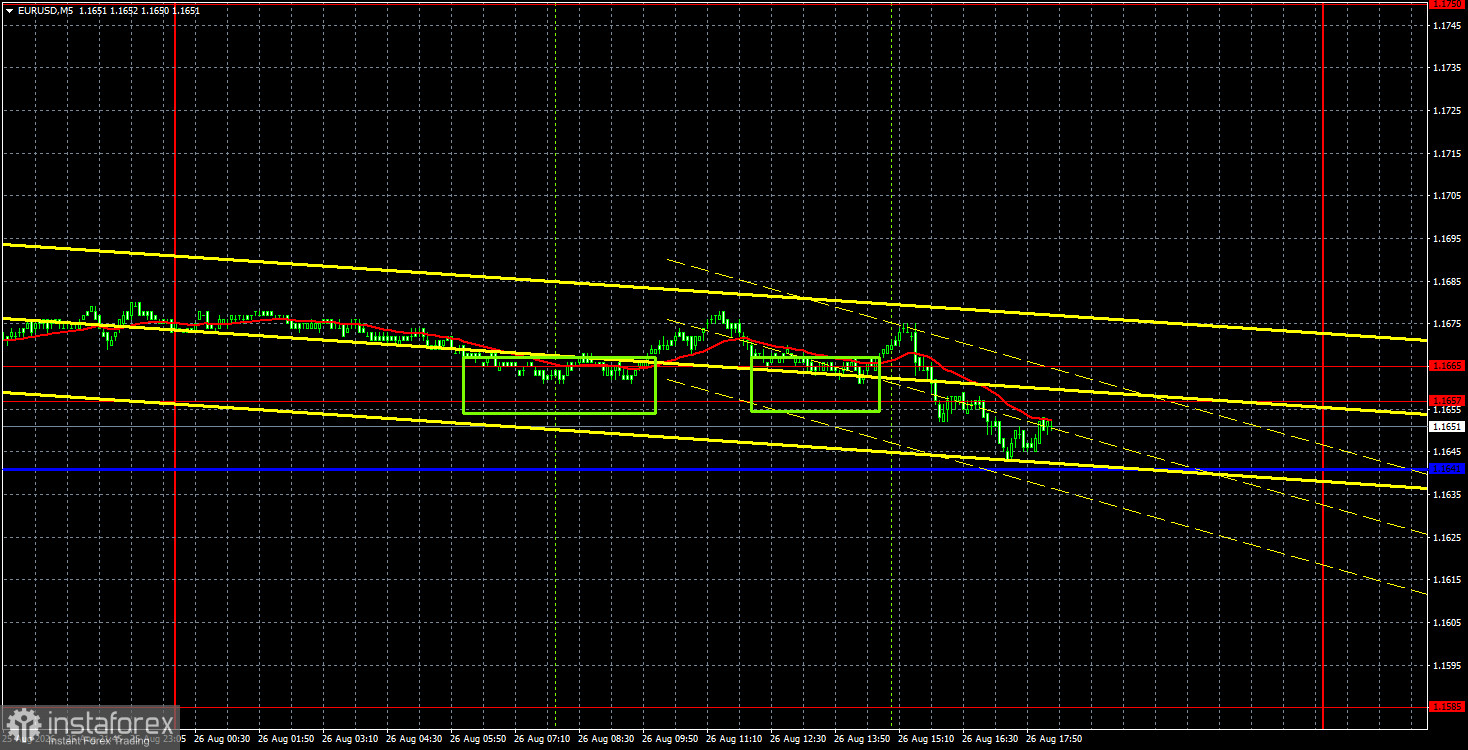
The EUR/USD currency pair continued to trade with minimal volatility and a bearish corrective bias on Wednesday. The correction began last week, and over four full days, the euro has retreated from recent highs by 50 pips. However, this was enough to break below the ascending trendline, thus formally canceling the upward trend. Yet this cancellation is only formal. When the market exhibits such weak movements, or a flat range as we are seeing now, many false signals can be generated. We believe that the breach of the trendline is one such signal. It seems that upward movement can resume at any moment.
Yesterday, no important reports were published in Germany or the Eurozone, while several reports came out in the U.S. The second estimate of GDP for the second quarter was unchanged from the first, orders for durable goods were above expectations, and the personal consumption expenditures price index matched forecasts at 0.2%. Thus, traders could only react to the durable goods orders report, which they did, leading to a slight strengthening of the dollar that did not affect the current technical picture.
From a technical perspective, the pair continues to form an upward trend, despite breaching the trendline. None of the global factors currently favor the U.S. dollar. We believe that discussions about the completion of the upward trend can only be made below the Senkou Span B line.
On the 5-minute timeframe on Wednesday, two buy signals were generated. Both could easily have been ignored, as with volatility around 30 pips, no signal would have yielded a profit.
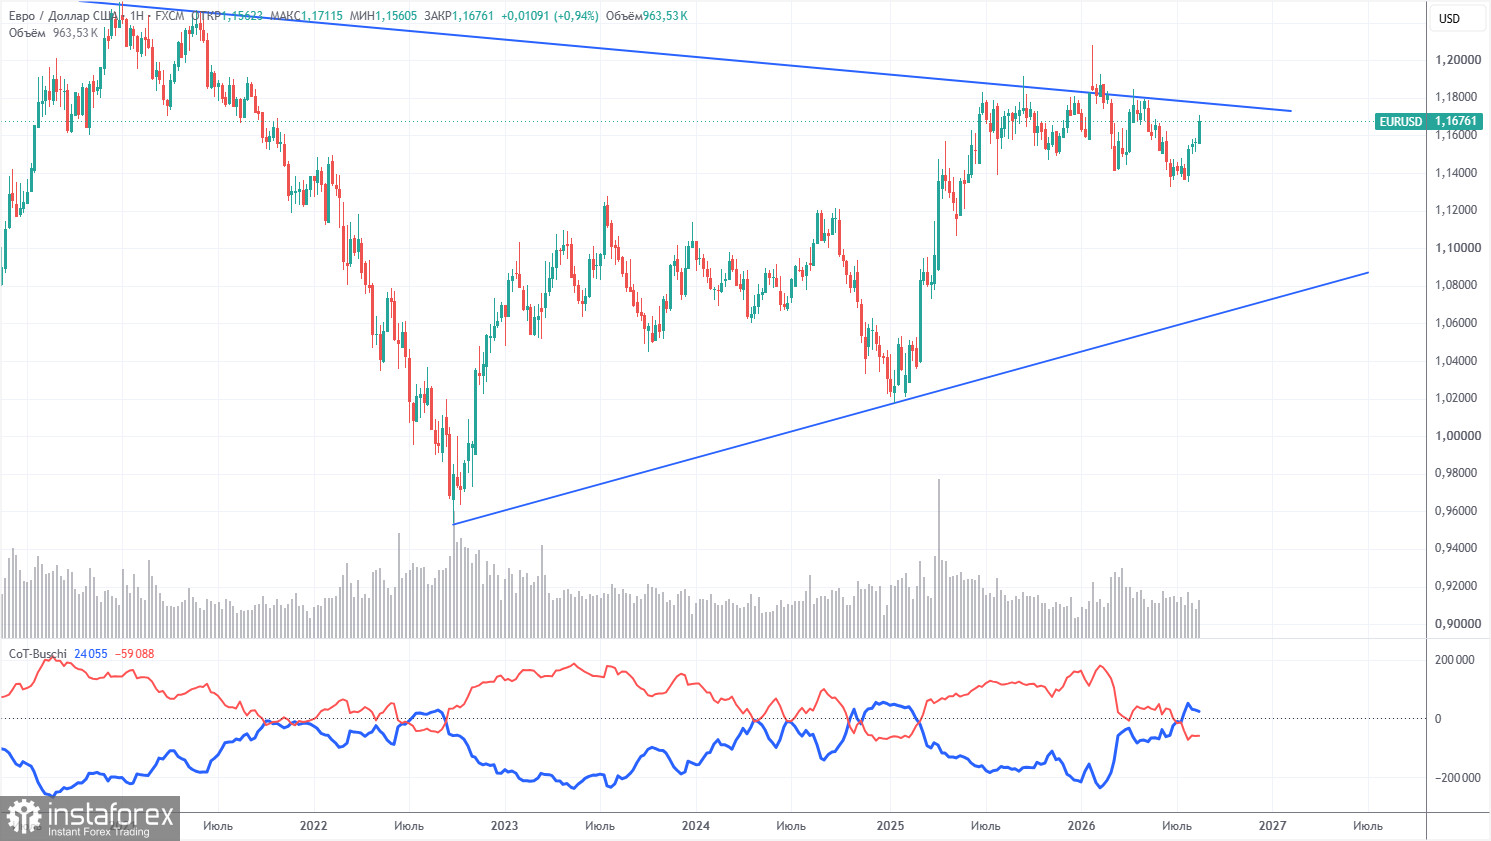
The latest COT report is dated August 18. The illustration of the weekly timeframe shows that the net position of non-commercial traders has turned bearish and has significantly decreased in 2026 due to geopolitical events. Traders have been offloading the euro in favor of the U.S. dollar in recent months. Trump's policies have not changed, but the dollar has temporarily acted as a "reserve currency."
We still do not see any fundamental factors to support the strengthening of the American currency. The war in the Middle East has made the dollar temporarily super-attractive, but once this factor loses its "shelf life," everything will revert to the norm. This process may already have concluded. In the long term, the euro could fall to the level of $1.08 (the trend line), but the upward trend will still remain relevant. Moreover, over the past months of dollar growth, the pair has not come particularly close to this line.
The positioning of the red and blue lines indicates parity between bulls and bears. During the last reporting week, the number of longs in the "Non-commercial" group decreased by 900, while the number of shorts increased by 1,800. Accordingly, the net position rose by 900 contracts over the week.
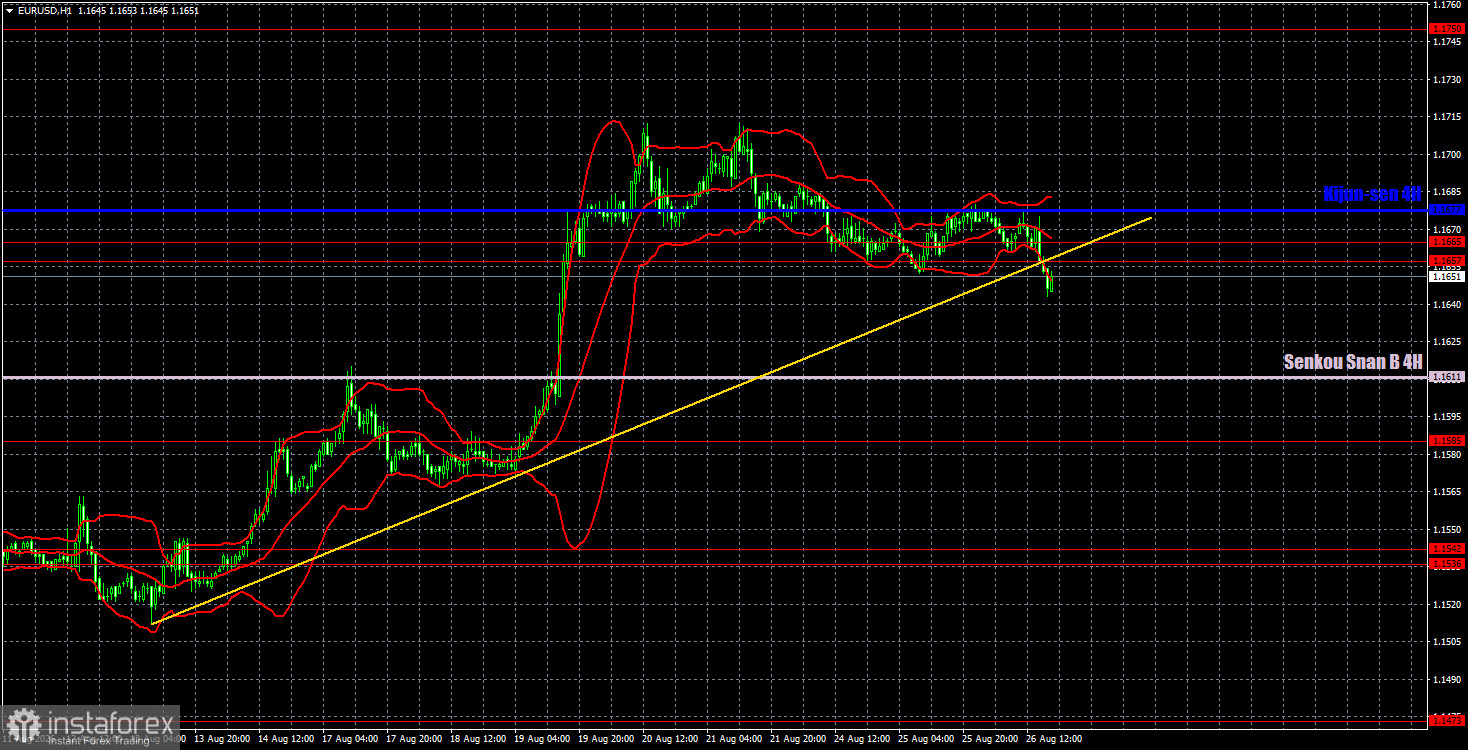
On the hourly timeframe, the pair retains its upward trend. The situation in the Middle East remains tense and is not improving, but this is insufficient for a renewed strong dollar rally. There are currently no significant factors favoring the U.S. dollar, so the euro maintains excellent chances for medium-term growth. In contrast, the dollar can only hope for a technical correction and geopolitical factors.
For August 27, we highlight the following trading levels — 1.1234, 1.1274, 1.1362-1.1368, 1.1461-1.1473, 1.1536-1.1542, 1.1585, 1.1657-1.1665, 1.1750-1.1760, 1.1786, 1.1830-1.1837, as well as the Senkou Span B line (1.1611) and the Kijun-sen line (1.1677). The Ichimoku indicator lines may shift throughout the day, which should be taken into account when determining trading signals. Don't forget to set a stop-loss to break even if the price moves in the right direction by 15 pips. This will protect against potential losses if the signal proves false.
On Thursday, Germany will release its consumer confidence index, and the U.S. will report unemployment claims. Both reports are absolutely secondary, so we do not expect any reaction to them. Most likely, we will experience another boring day with very low volatility.
Today, traders may consider short positions with targets at 1.1611 and 1.1585 if the price remains below the 1.1657-1.1665 area. A strong close above the Kijun-sen line will open up long positions with a target in the 1.1750-1.1760 range. However, it should be remembered that market movements today may also be very weak.
InstaForex analytical reviews will make you fully aware of market trends! Being an InstaForex client, you are provided with a large number of free services for efficient trading.


