 Stay
Stay 
Trading Conditions
Products
Tools



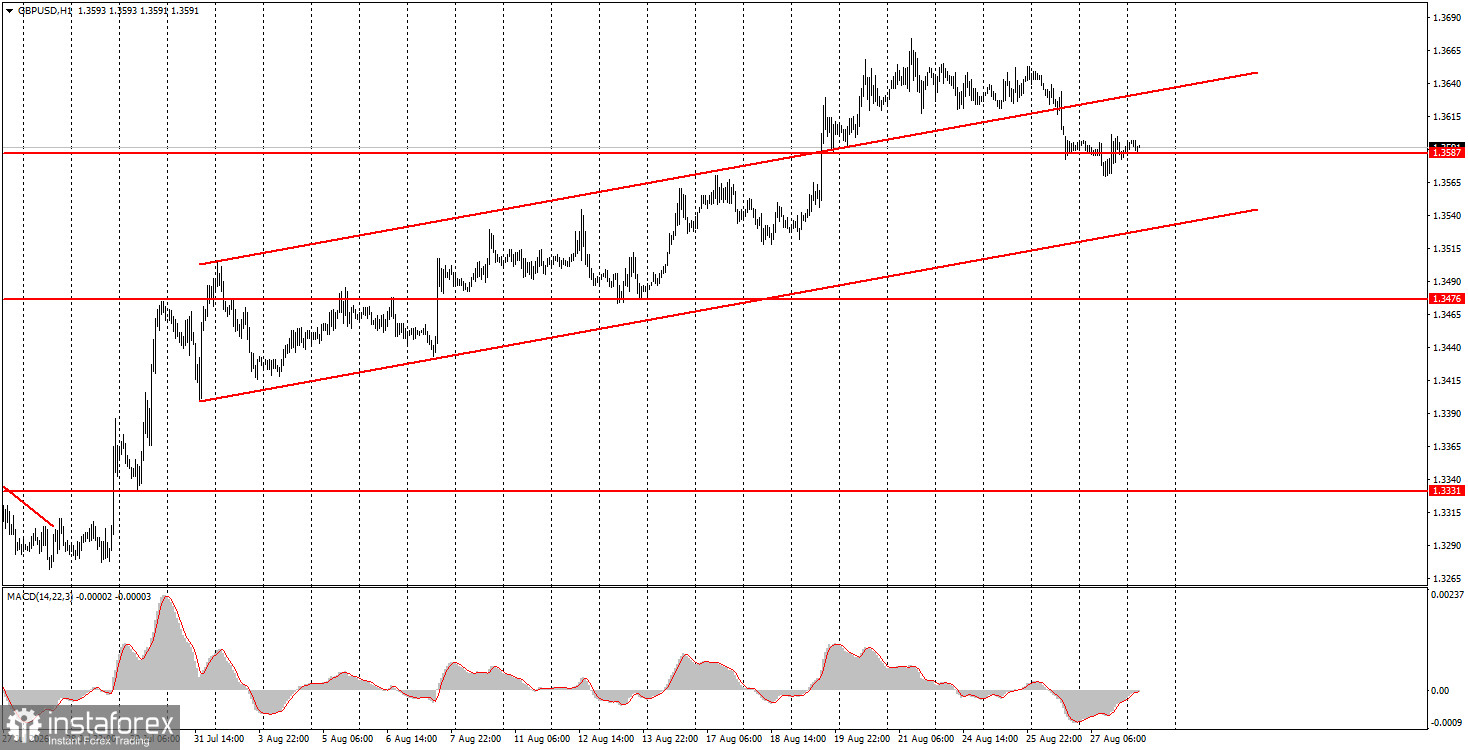
The GBP/USD pair traded with minimal volatility again on Thursday. This week, the British pound experienced a slight correction, but the upward trend was not broken due to this correction. Thus, the growth of the British currency could resume at any moment. We would not advise novice traders to open new buy positions "in the air." This week, traders might have the impression that a new decline in the American currency is inevitable – they need to wait for Kevin Warsh's speech and the publication of the Non-Farm Payrolls. However, we want to remind you that the Federal Reserve Chair can say anything, and it is impossible to predict in advance. How the market interprets his words is also uncertain. Therefore, a rise in the dollar today cannot be ruled out. However, the probability of a further decline in the American currency is much higher. Non-Farm Payrolls are typically revised downward, and the market currently has little trust in Warsh.
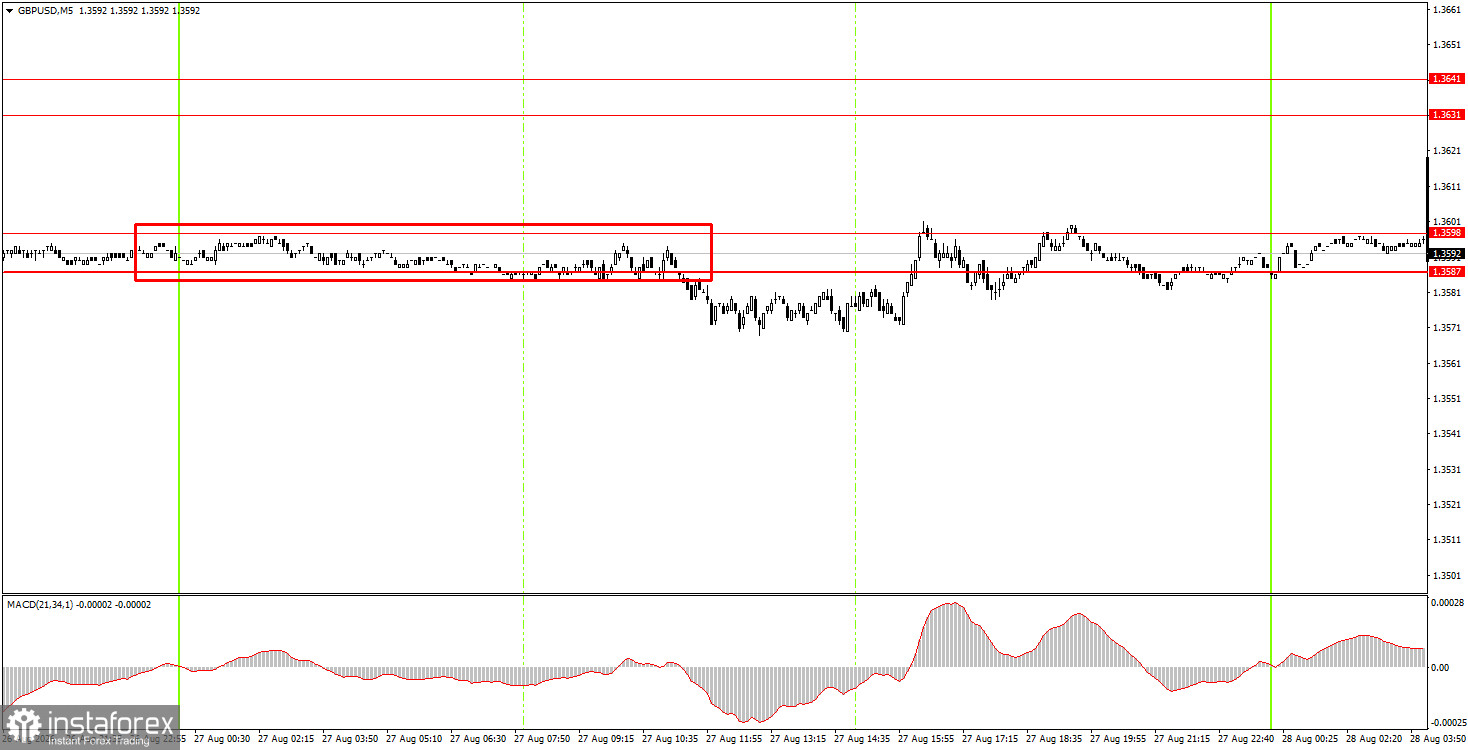
On the 5-minute timeframe, one sell signal was formally generated on Thursday. "Formally" because volatility was once again minimal, and the price after the signal formation did not manage to move in the right direction by even 20 pips.
On the hourly timeframe, the GBP/USD pair continues to maintain an upward trend. In our view, the British pound should continue to rise, even if local factors do not support it. On the weekly timeframe, the move from the lower boundary of the sideways channel to the upper boundary is ongoing and not yet complete. Market confidence in a Fed rate hike in September is visibly fading, and all recent macroeconomic data and events have pressured the dollar. Only a close below the ascending channel on the hourly timeframe would suggest a potential decline in the pair for technical reasons.
On Friday, novice traders may consider opening short positions if the close is below the 1.3587-1.3598 area, with targets at 1.3456-1.3476. Long positions can be initiated with targets at 1.3631-1.3641 and 1.3695 if the price bounces from the 1.3587-1.3598 area.
On the 5-minute timeframe, trading levels to consider are 1.3259-1.3267, 1.3319-1.3331, 1.3380-1.3386, 1.3456-1.3476, 1.3587-1.3598, 1.3631-1.3641, 1.3695, and 1.3741. On Friday, there are no significant events or publications planned in the UK, as there haven't been throughout the current week. In the U.S., there are two key events today – the annual Non-Farm Payroll report and Warsh's speech.
Support and resistance price levels (areas) are the targets when opening buy or sell orders or sources of signals.
Red lines denote channels or trend lines that reflect the current trend and indicate in which direction trading is currently favored.
The MACD indicator (14,22,3) – histogram and signal line – is a supporting indicator that can also be used as a source of signals.
Important speeches and reports (as listed in the news calendar) can significantly influence the movement of the currency pair. Therefore, during their release, trading should be approached with utmost caution, or one should exit the market to avoid sharp price reversals against the preceding movement.
Beginners in Forex trading should remember that not every trade can be profitable. Developing a clear strategy and proper money management are essential for long-term trading success.
InstaForex analytical reviews will make you fully aware of market trends! Being an InstaForex client, you are provided with a large number of free services for efficient trading.


