 Stay
Stay 
Trading Conditions
Products
Tools



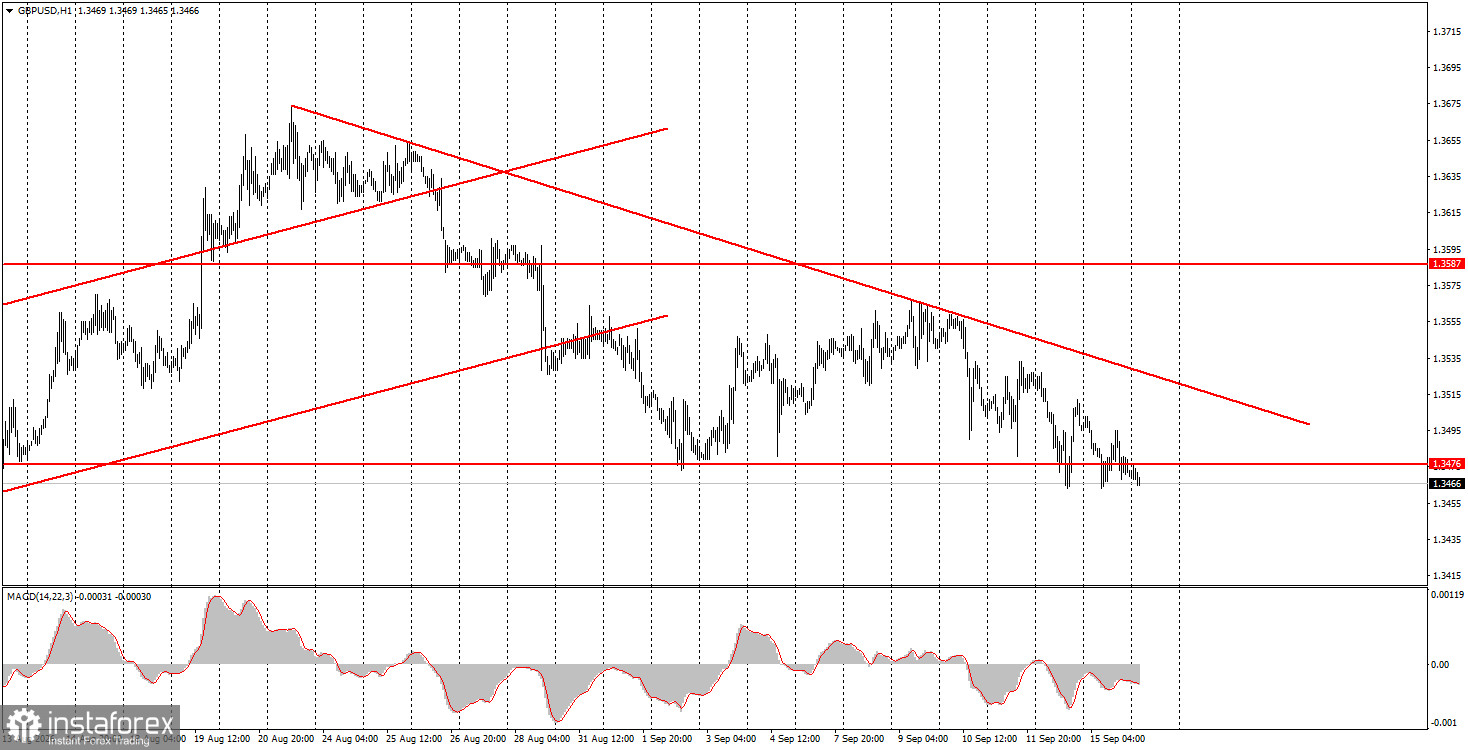
On Tuesday, the GBP/USD pair continued its downward move in line with the prevailing downtrend. The trend line clearly shows the direction the market is focusing on right now. Several moderately important UK reports were published yesterday, but the market largely ignored them. This is visible even from overall volatility, which amounted to only about 40 pips. The unemployment rate, for example, came in at 4.9% versus forecasts of 5.0% — so the most important report printed better than expected. Nevertheless, the pound failed to show any meaningful rally. This indicates the market remains fully focused on the Federal Reserve meeting and expects monetary tightening. The Fed will likely raise the policy rate simply because the market has been pricing it in. Many experts note there was no urgent need to hike specifically in September; the dollar's rise is driven primarily by market expectations of Fed tightening.
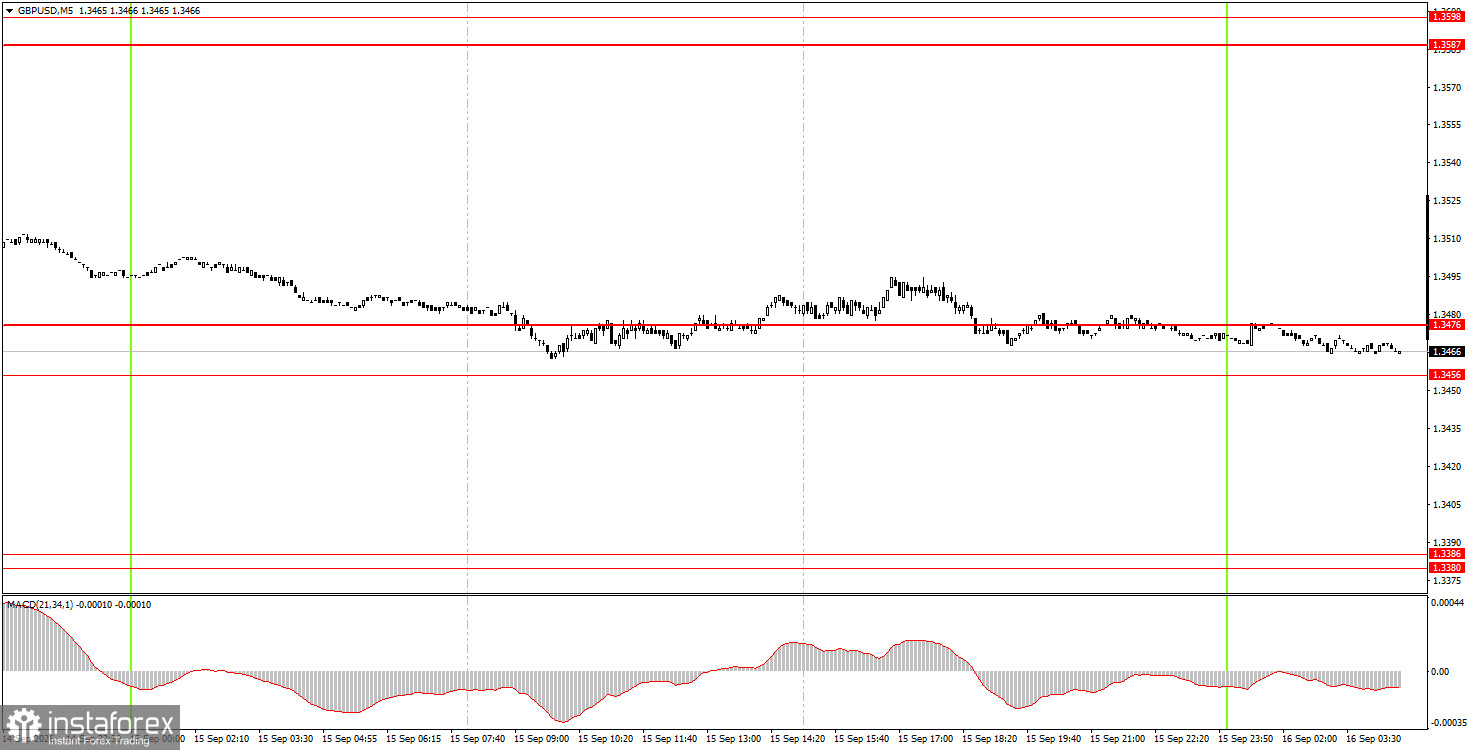
On the 5-minute timeframe on Tuesday, no trading signals were formed. Price traded around the 1.3456–1.3476 area during the day, testing it from time to time. Thus, a buy signal could be found if desired, but intraday movement was minimal.
On the hourly timeframe, the GBP/USD pair continues a downward corrective trend that may end soon. In our view, sterling should continue to rise in the medium term under most scenarios, but it is currently undergoing a correction. On the weekly timeframe, the move from the lower boundary of the sideways channel toward the upper boundary continues and may not yet be complete. Therefore, we expect the northbound impulse to resume.
On Wednesday, novice traders may consider short positions targeting 1.3380–1.3386 if price consolidates below 1.3456–1.3476. Open long positions targeting 1.3587–1.3598 if price bounces off the 1.3456–1.3476 area.
On the 5-minute timeframe, you can trade the levels 1.3259–1.3267, 1.3319–1.3331, 1.3380–1.3386, 1.3456–1.3476, 1.3587–1.3598, 1.3631–1.3641, 1.3695, 1.3741. On Wednesday, the UK will publish an important August inflation report that may strongly influence the Bank of England's stance tomorrow and for the rest of the year. In the U.S. today — the Fed meeting and remarks by Kevin Warsh.
Price levels (areas) of support and resistance serve as targets for opening buy or sell trades or as sources of signals.
Red lines indicate channels or trend lines that show the current trend and the preferred trading direction.
The MACD indicator (14,22,3) — the histogram and signal line — is an auxiliary indicator that can also provide signals.
Important speeches and reports (listed in the news calendar) can significantly influence currency pair movements. Therefore, during their release, traders should approach trading with utmost caution, or exit the market to avoid sudden reversals against the preceding move.
Beginner forex traders should remember that not every trade can be profitable. Developing a clear strategy and practicing money management are key to long-term success in trading.
InstaForex analytical reviews will make you fully aware of market trends! Being an InstaForex client, you are provided with a large number of free services for efficient trading.


