 Stay
Stay 
Trading Conditions
Products
Tools



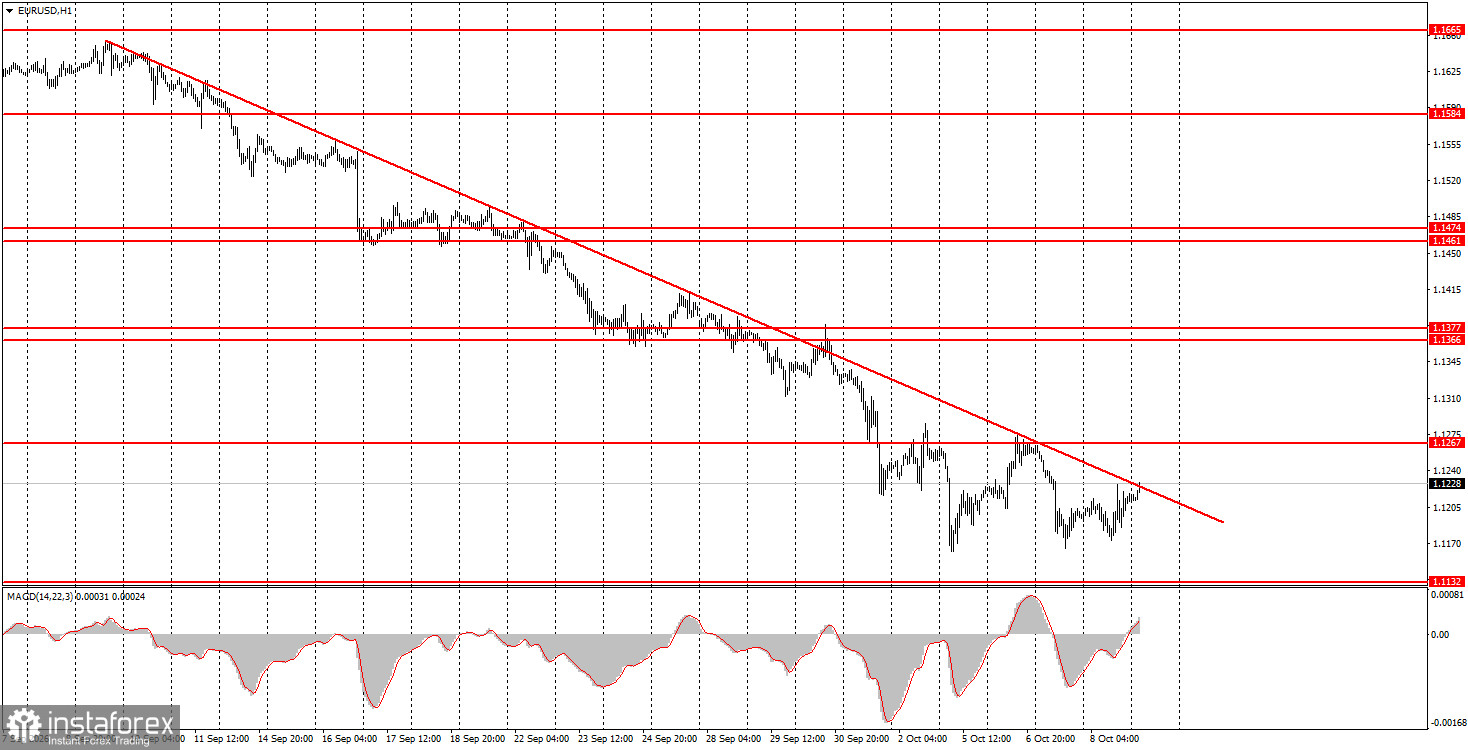
On Thursday, EUR/USD tried to correct again, but over the past 7–8 days it has been stuck in a sideways channel near a one-and-a-half-year low. This flat really says only one thing: after a month of decline, the euro is so weak it cannot even produce a meaningful correction. The trendline remains relevant, and breaking it inside a flat will not mean the downtrend is over. The difficulty of the current move is that traders are beginning to believe the dollar will keep rising for a long time. In reality, the pair's decline could end at any moment with a powerful euro rally, because the dollar is, in our view, overbought and unjustifiably expensive. The market has already priced the possible drivers of USD strength multiple times. Nobody can stop participants from continuing to buy the US currency, and nobody knows how many more "black swans" may arrive. But based on current geopolitics, fundamentals, and macro data, EUR/USD has no justification for being this low.
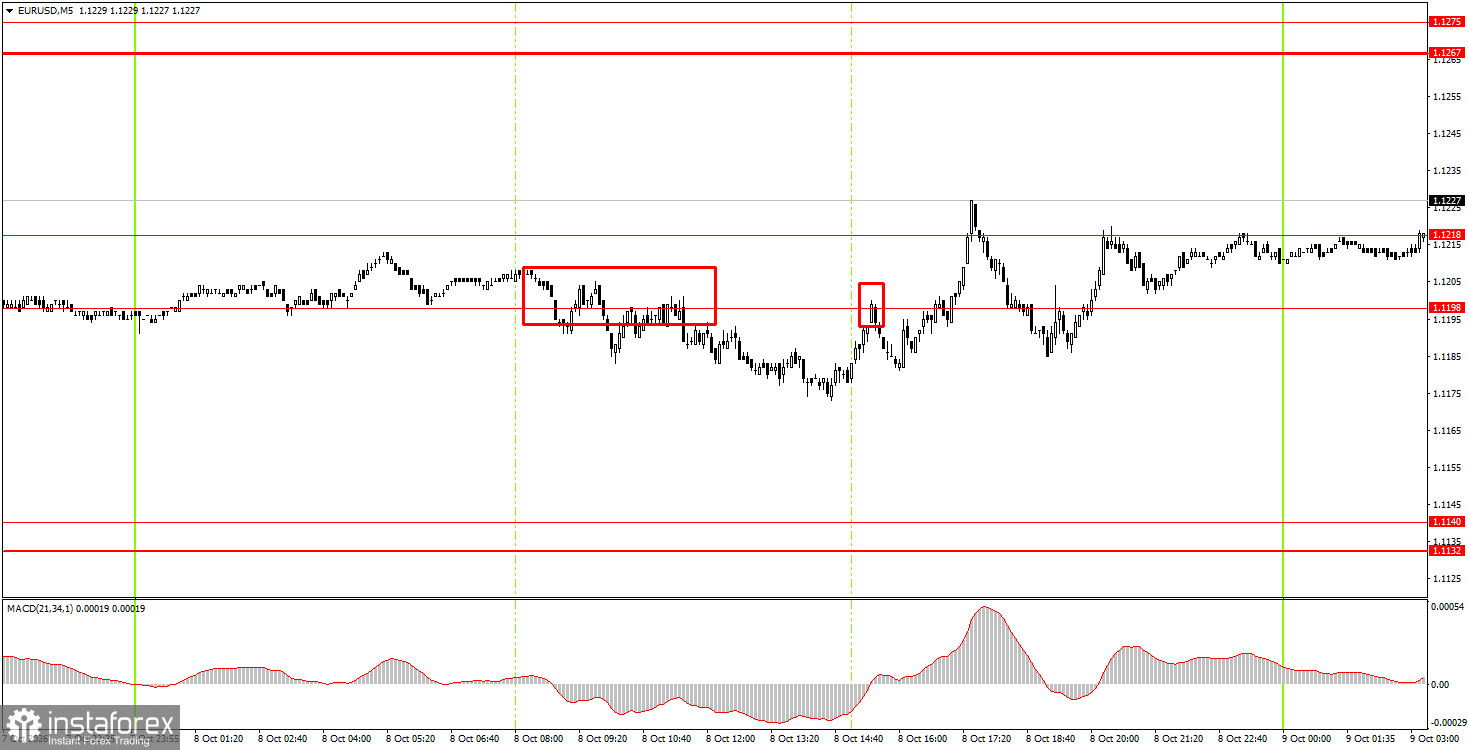
On the 5-minute TF on Thursday, two sell signals formed, but intraday moves were choppy overall. The market clearly doesn't want to buy, and sellers can no longer push far. Price bounced twice off the 1.1198–1.1218 area but could not drop more than about 15 pips—enough for a short position's Stop Loss to move to breakeven.
On the hourly timeframe, EUR/USD continues a downtrend that is now a full-fledged trend. Given recent months' events, we do not believe the euro should collapse like a stone. Yet the market keeps buying the US dollar, ignoring events and releases.
On Friday, novice traders can consider new short positions if price consolidates below 1.1198–1.1218, with targets at 1.1132–1.1140. Open long positions on a confirmed close above 1.1198–1.1218, targeting 1.1267–1.1275.
On the 5-minute TF consider these levels: 1.1088, 1.1132–1.1140, 1.1198–1.1218, 1.1267–1.1275, 1.1366–1.1377, 1.1461–1.1474, 1.1527–1.1531, 1.1584–1.1594, 1.1655–1.1665. On Friday, the only notable release is the University of Michigan consumer-sentiment index in the US, and that is the one event the market might pay attention to. However, we don't expect a strong reaction to that report because the market is currently trading on its own terms.
Price levels (areas) of support and resistance serve as targets for opening buy or sell trades or as sources of signals.
Red lines indicate channels or trend lines that show the current trend and the preferred trading direction.
The MACD indicator (14,22,3) — the histogram and signal line — is an auxiliary indicator that can also provide signals.
Important speeches and reports (listed in the news calendar) can significantly influence currency pair movements. Therefore, during their release, traders should approach trading with utmost caution, or exit the market to avoid sudden reversals against the preceding move.
Beginner forex traders should remember that not every trade can be profitable. Developing a clear strategy and practicing money management are key to long-term success in trading.
InstaForex analytical reviews will make you fully aware of market trends! Being an InstaForex client, you are provided with a large number of free services for efficient trading.


