 Stay

Trading Conditions
Products
Tools


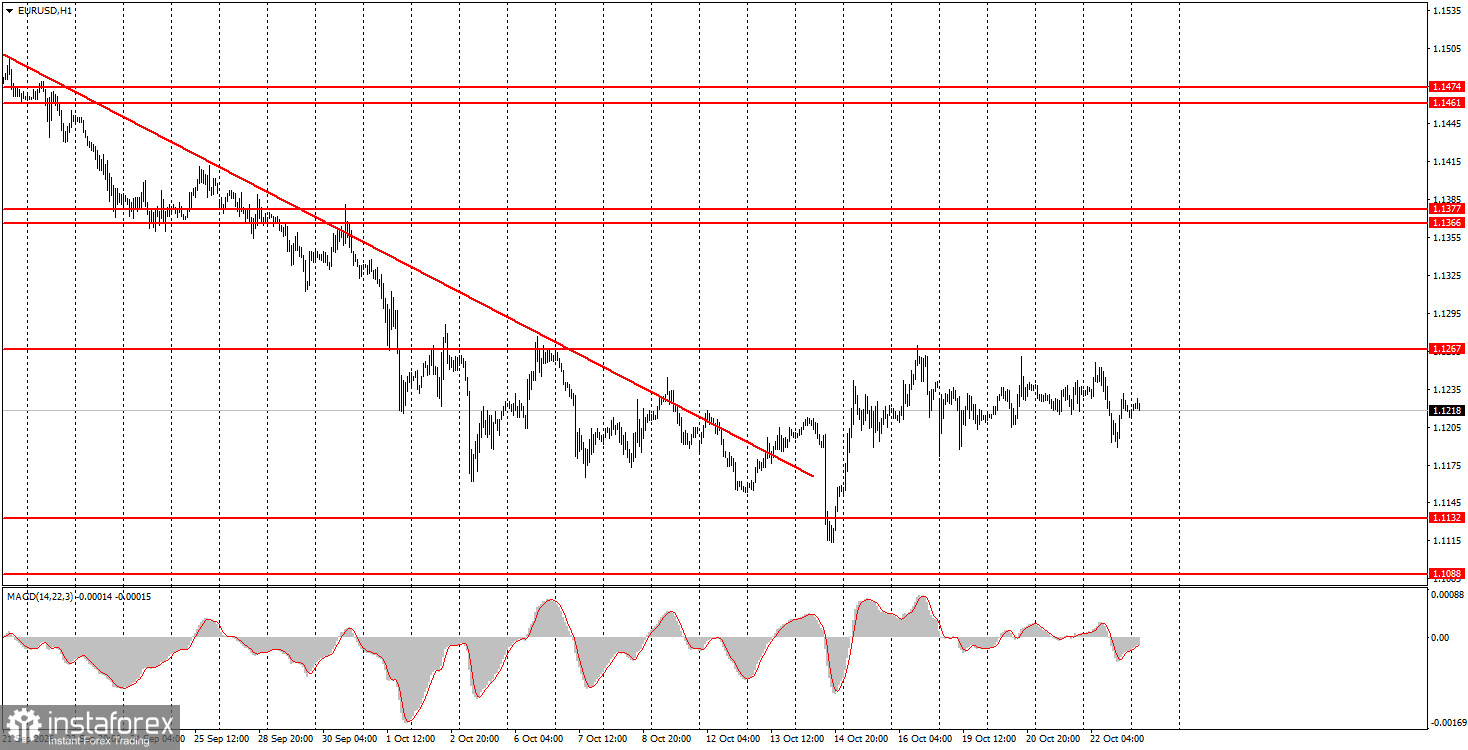
The EUR/USD pair again showed no interesting moves on Thursday, and the macroeconomic and fundamental backdrop was absent. The pair saw a small decline, but it didn't affect the overall technical picture, as the hourly TF shows. Essentially, the euro has been trading between 1.1190 and 1.1260 all week. After a month-long fall, the market still cannot find a reason to buy the euro. We can only wait for the European Central Bank and Federal Reserve meetings next week. We would not be surprised if the U.S. dollar starts to strengthen again even if both central banks leave key rates unchanged. Unfortunately, the market still ignores most of the positive backdrop for the euro. More precisely, it ignores positive news for the euro while reacting twice as strongly to negative news. The downtrend is formally over, but price still cannot overcome the nearest resistance at 1.1267.
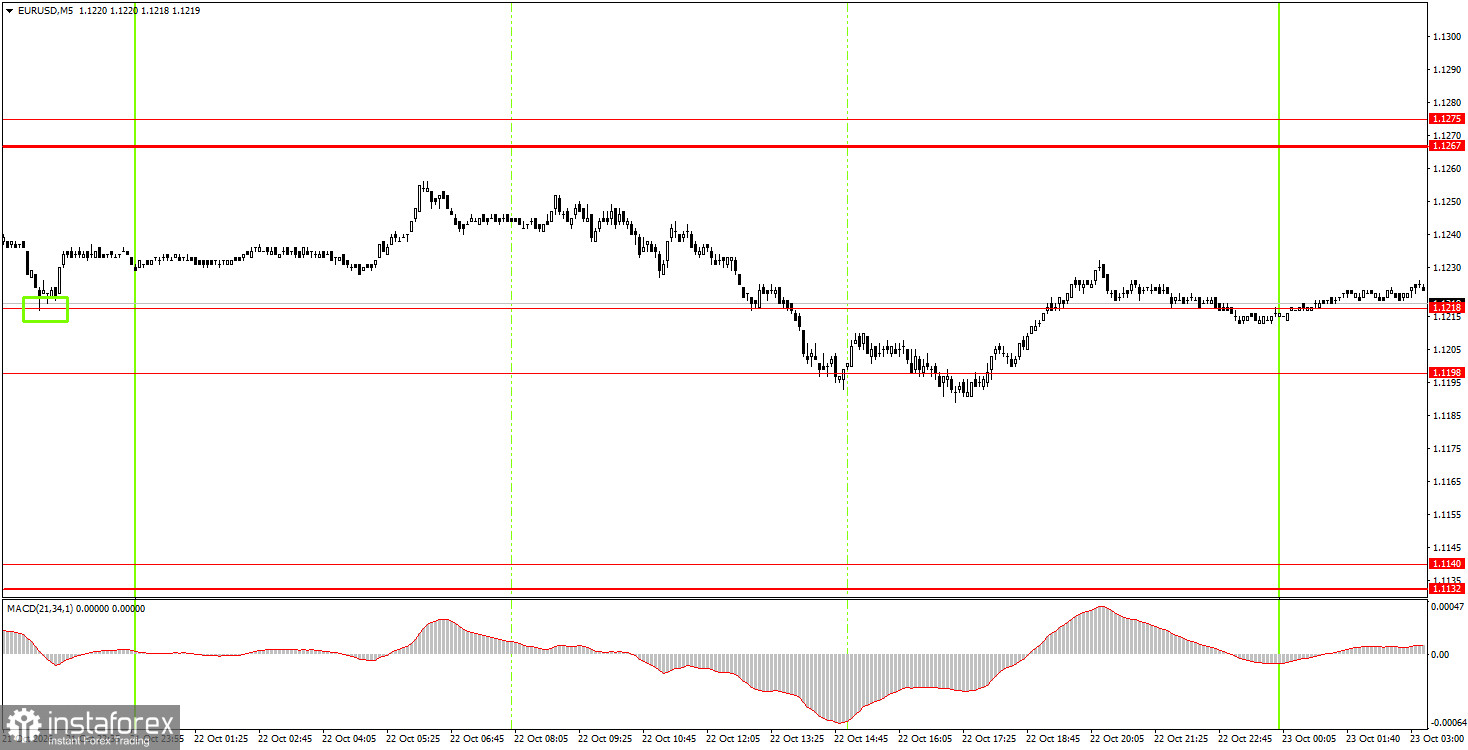
On the 5-minute TF, no trading signals formed on Thursday. During the European session, price fell into the 1.1198–1.1218 area, but by the end of the day failed to convincingly hold below it or bounce off it.
On the hourly timeframe, the EUR/USD pair retains a downward tendency that is a full-fledged trend, but there are reasons to believe the trend is finished. Given recent months' events, we don't think the euro should have fallen like a stone. Currently, the dollar is heavily overbought, and many euro-bullish factors are being ignored.
On Friday, novice traders can consider new short positions if the pair holds below the 1.1198–1.1218 area, targeting 1.1132–1.1140. Open long positions on a new bounce from the 1.1198–1.1218 area, targeting 1.1267–1.1275.
On the 5-minute TF consider the levels 1.1011, 1.1088, 1.1132–1.1140, 1.1198–1.1218, 1.1267–1.1275, 1.1366–1.1377, 1.1461–1.1474, 1.1527–1.1531, 1.1584–1.1594, 1.1655–1.1665. On Friday, the EU and US release business-activity indices for October. European indices may prompt a market reaction, while US traders will prefer to wait for the ISM readings. Moves today may be somewhat more active than the week's average.
Price levels (areas) of support and resistance serve as targets for opening buy or sell trades or as sources of signals.
Red lines indicate channels or trend lines that show the current trend and the preferred trading direction.
The MACD indicator (14,22,3) — the histogram and signal line — is an auxiliary indicator that can also provide signals.
Important speeches and reports (listed in the news calendar) can significantly influence currency pair movements. Therefore, during their release, traders should approach trading with utmost caution, or exit the market to avoid sudden reversals against the preceding move.
Beginner forex traders should remember that not every trade can be profitable. Developing a clear strategy and practicing money management are key to long-term success in trading.
InstaForex analytical reviews will make you fully aware of market trends! Being an InstaForex client, you are provided with a large number of free services for efficient trading.


