
 Stay
Stay 


Patterns are graphical models which are formed in the chart by the price. According to one of the technical analysis postulates, history (price movement) repeats itself. It means that the price movements are often similar in the same situations which makes it possible to predict the further development of the situation with a high probability.
Discover Forex chart patterns, signals, and trading strategies on InstaForex.
was formed on 28.07 at 21:51:00 (UTC+0)
signal strength 1 of 5
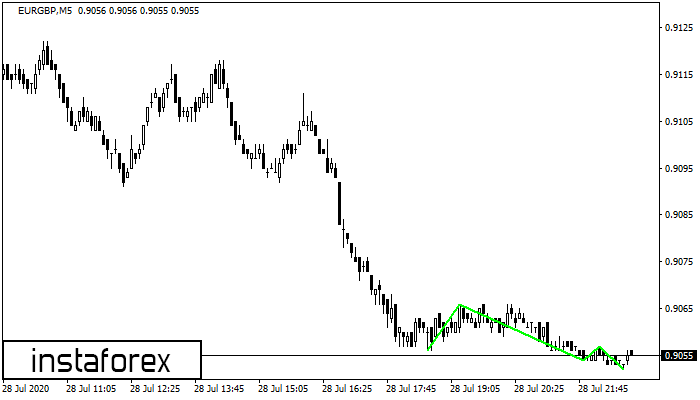
The Triple Bottom pattern has formed on the chart of EURGBP M5. The lower boundary is at 0.9052, while the upper boundary is at 0.9066/0.9057. The projected width is 12 points. The formation of the Triple Bottom pattern most likely indicates a change from a downward to an upward trend. If the confirmation resistance at 0.9066 is broken, the price is likely to continue upward.
The M5 and M15 time frames may generate more false entry signals.


