 Anuluj
Warunki handlowe
Narzędzia


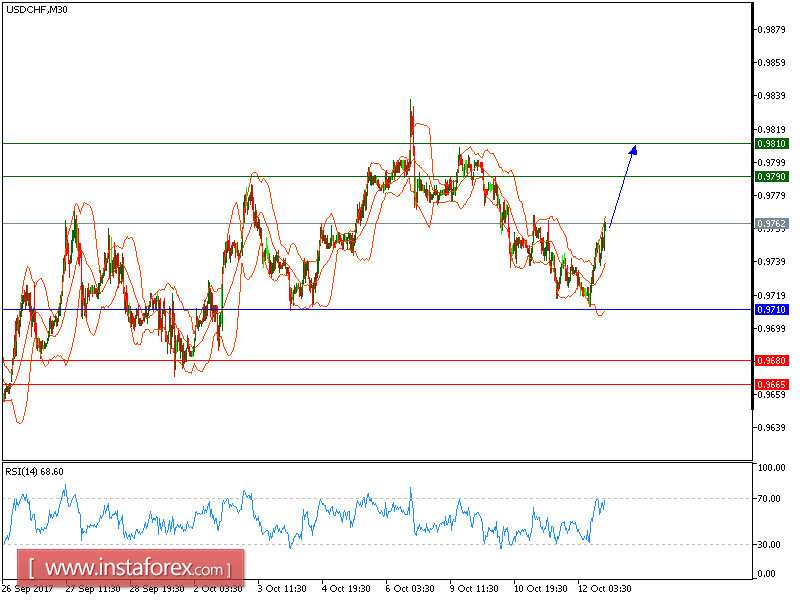
USD/CHF is expected to trade with bullish outlook. The pair broke above the falling broadening wedge, which confirmed the continuation of bullish trend. The rising 20-period moving average is playing a support role. The relative strength index broke above a bearish trend line.
The market showed muted reaction to minutes of the Federal Reserve's latest policy meeting, which showed most officials expected another interest-rate increase this year. Meanwhile, sentiment was boosted by a media report that Treasury Secretary Steven Mnuchin was persuading President Donald Trump to nominate Jerome Powell, who is seen as friendly to the financial markets, as the next Federal Reserve chairman.
Hence, as long as 0.9710 is not broken, look for a further upside to 0.9790 and even to 0.9810 in extension.
Chart Explanation: The black line shows the pivot point. The present price above the pivot point indicates a bullish position, and the price below the pivot points indicates a short position. The red lines show the support levels and the green line indicates the resistance levels. These levels can be used to enter and exit trades.
Strategy: BUY, Stop Loss: 0.9710, Take Profit: 0.9790
Resistance levels: 0.9790, 0.9810, and 0.9845
Support levels: 0.9680, 0.9665, and 0.9615
Dzięki analizom InstaForex zawsze będziesz na bieżące z trendami rynkowymi! Zarejestruj się w InstaForex i uzyskaj dostęp do jeszcze większej liczby bezpłatnych usług dla zyskownego handlu.


