 Anuluj
Warunki handlowe
Narzędzia


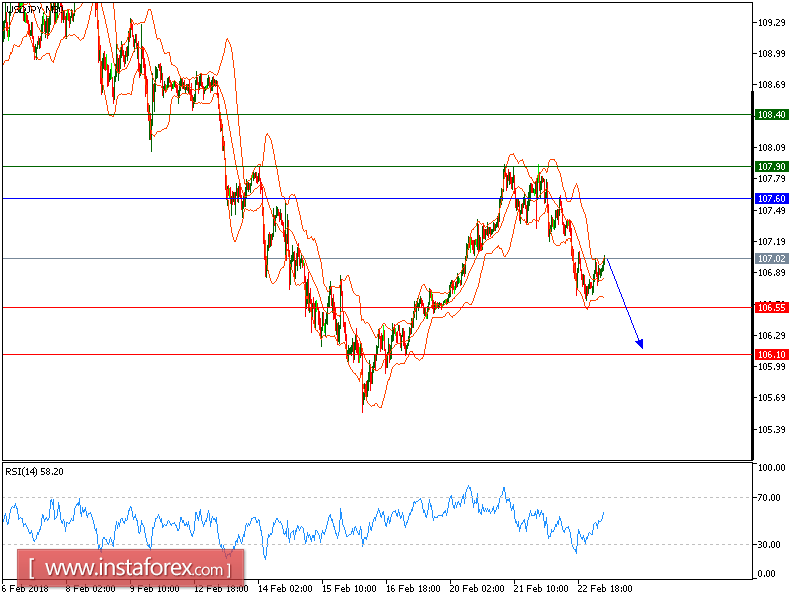
USD/JPY is expected to trade with a bearish outlook as the key resistance is at 107.60. The pair is off the low of 106.58 seen overnight (February 22). Currently, it has returned to levels above the descending 20-period moving average while being capped by the 50-period one and the key resistance at 107.15. The relative strength index has not yet recovered the neutral level of 50, indicating a lack of upward momentum for the pair. As long as the key resistance at 107.65 is not surpassed, intraday bearishness persists, and the pair could pull back to 106.55 (around the yesterday low) before declining further to 106.10.
Alternatively, if the price moves in the opposite direction, a long position is recommended to be above 107.60 with a target of 107.90.
Chart Explanation: The black line shows the pivot point. The current price above the pivot point indicates a bullish position, while the price below the pivot point is a signal for a short position. The red lines show the support levels, and the green line indicates the resistance level. These levels can be used to enter and exit trades.
Strategy: SELL, stop loss at 107.60, take profit at 106.55.
Resistance levels: 107.90, 108.40, and 108.90
Support levels: 106.55, 106.10, and 105.70.
Dzięki analizom InstaForex zawsze będziesz na bieżące z trendami rynkowymi! Zarejestruj się w InstaForex i uzyskaj dostęp do jeszcze większej liczby bezpłatnych usług dla zyskownego handlu.


