 Anuluj
Warunki handlowe
Narzędzia


Gold price has broken $1,500 at the beginning of the week and has already reached our first target of $1,461 with a low at $1,459. Our next target is at $1,418 as long as price is below $1,500.
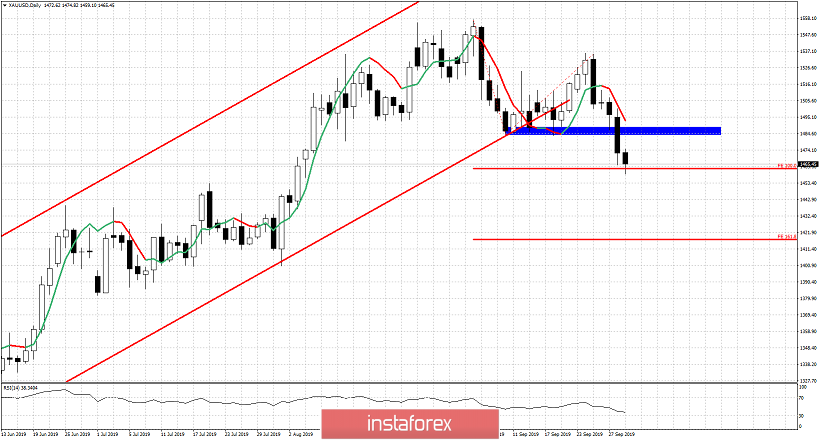
Blue rectangle- resistance (previous support)
Gold price has already reached the 100% Fibonacci extension of the first leg down. Trend is bearish as long as price is below $1,535. As long as price is below $1,500 we expect a move lower towards $1,418 which is our next target. Price has broken out of the bullish channel and this is time for a correction as we also showed at the start of the week with our weekly chart.
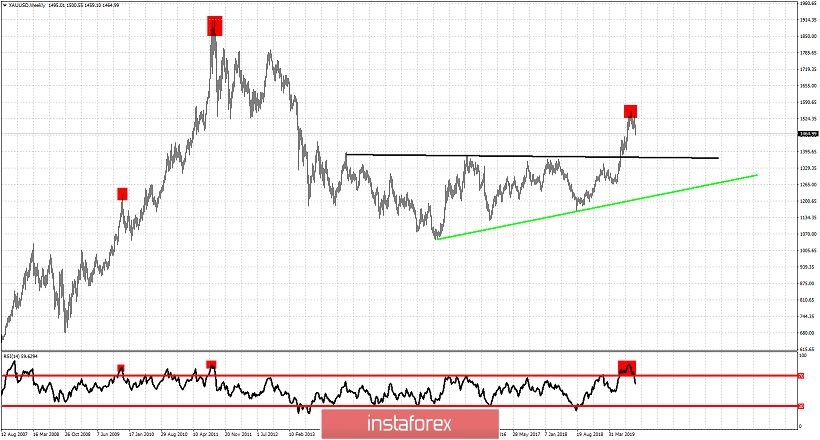
Red rectangles - topping signs
Black line - major resistance trend line (broken) now support
Green line - major upward trend line support
Gold price is overbought as the weekly RSI shows. In our previous posts I noted the importance and the warning signs from this weekly chart. The RSI turning below 70 is a sign of weakness and we already expected this pull back. This pull back can unfold into something bigger but it is too early to tell. For now we remain bearish as we consider the recent highs above $1,550 to be an important top. A break above $1,535 will open the way for a move above $1,600.
Dzięki analizom InstaForex zawsze będziesz na bieżące z trendami rynkowymi! Zarejestruj się w InstaForex i uzyskaj dostęp do jeszcze większej liczby bezpłatnych usług dla zyskownego handlu.


