 Anuluj
Warunki handlowe
Narzędzia


Gold price had a good week so far making new higher highs. Trend remains bullish but traders should be very cautious. Today we take a look at the very short-term possibility of a pull back and the longer-term chances of a major top coming.
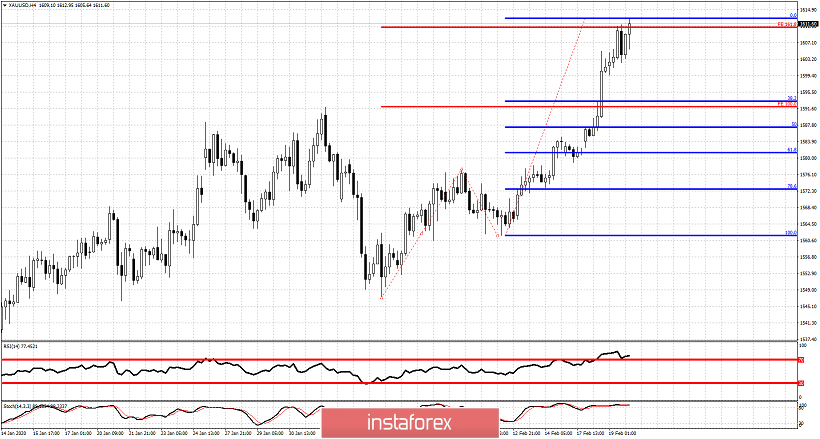
Blue lines - Fibonacci retracement
The latest leg up in Gold that started at $1,561 is the 161.8% extension of the first upward move from $1,547 to $1.577. This extension is a very common target and prices usually make a short-term top at this level. With the RSI and stochastic diverging in overbought levels, I expect price to pull back towards the 38% Fibonacci retracement and the $1,600-$1,590 area.
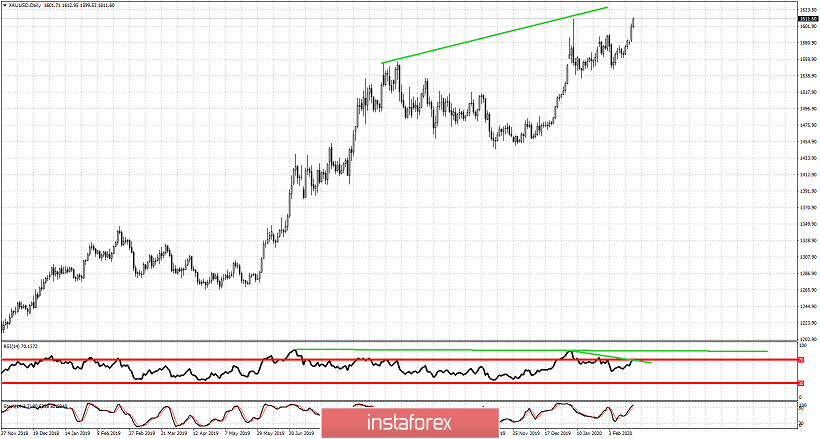
In the Daily chart we so far have a second higher high and a second bearish divergence. This is a big warning for Gold bulls. Although I feel the current move is not finished, bulls should be very cautious as we could very well be close to the end of the entire upward move in Gold from the 2018 lows. Key long-term support is Gold is at $1,560. As long as we trade above this level, trend is bullish.
Dzięki analizom InstaForex zawsze będziesz na bieżące z trendami rynkowymi! Zarejestruj się w InstaForex i uzyskaj dostęp do jeszcze większej liczby bezpłatnych usług dla zyskownego handlu.


