 Anuluj
Warunki handlowe
Narzędzia


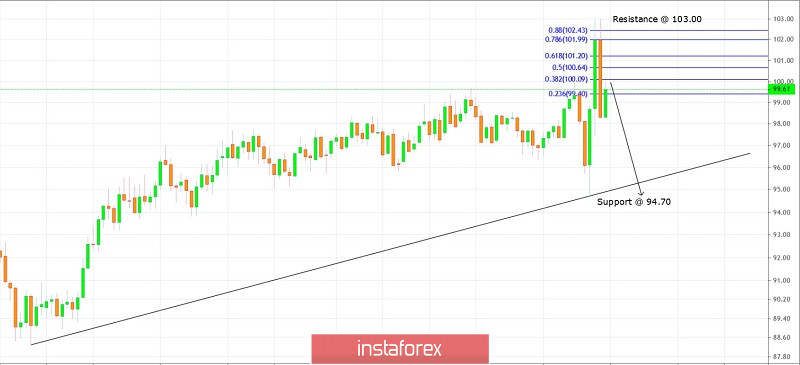
Technical outlook:
US Dollar Index has produced an engulfing bearish candlestick pattern on the weekly chart, after hitting highs at 103.00 levels. The index is currently trading around 99.61 levels and is expected to resume its drop lower towards the 94.70 levels as indicated on the chart here. Immediate support is at 94.70, while resistance is seen towards 103.00 levels respectively. Please note that a break below 94.70 support would confirm that the trend has reversed for medium to long term. Also note that US Dollar Index has tested the fibonacci 0.382 retracement around 100.00 levels, which should act as resistance. Trading point of view, it is good to initiate short positions around 99.60/100.00 levels, with risk above 103.00 and targets below 94.70 levels in the short term. Also note that a 2 year support trend line would also break if the index manages to print below the 94.70 support.
Trading plan:
Sell @ 99.60/100.00, stop @ 103.00 target @ 94.70
Good luck!
Dzięki analizom InstaForex zawsze będziesz na bieżące z trendami rynkowymi! Zarejestruj się w InstaForex i uzyskaj dostęp do jeszcze większej liczby bezpłatnych usług dla zyskownego handlu.


