 Anuluj
Warunki handlowe
Narzędzia


Overview :
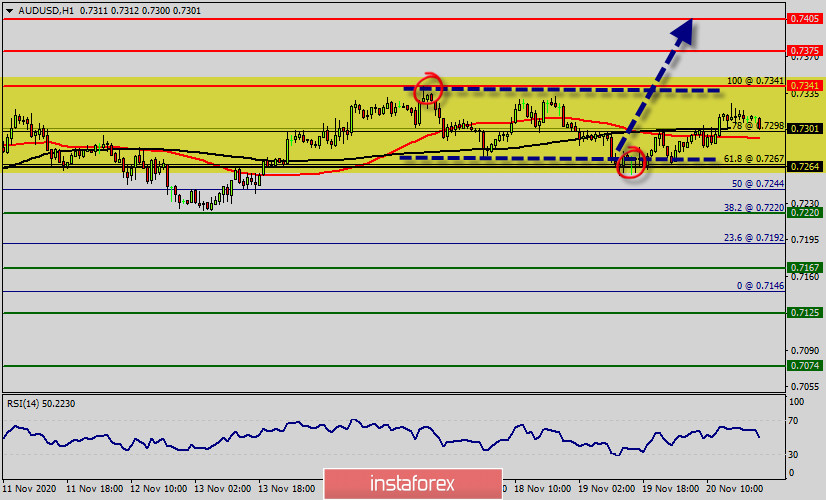
On the H1 chart :
A trend in the AUD/USD pair was argumentative as it was trading in a narrow sideways channel, the market showed signs of instability. Amid the previous events, the price is still moving between the levels of 0.7264 and 0.7341.
The Aussie closed up at the price of 0.7310 against the US dollar last week. The AUD/USD pair rallied significantly during the week, reaching towards 0.7341 handle. At this point in time, it looks like we are running out of momentum. Last week, the AUD/USD pair fell from to top point of 0.7341 to the bottom of 0.7264 to rebound toward 0.7301 (close price) The market is likely to continue to be very sharp if we do pull back from here, but it surely looks as if we are running out of a lot of the momentum.
Resistance and support are seen at the levels of 0.7341 (also, the double top is already set at the point of 0.7341) and 0.7264 respectively.
As the current rebound is pushing the Aussie close to this level once again, price action is trading above the 0.7264 handle. As long as the 0.7264 level holds, the AUD/USD pair is likely to trade subdued. There is a risk of rising further up to the 0.7341 handle.
Therefore, it is recommended to be cautious while placing orders in this area. So, we need to wait until the sideways channel has completed. The current price is seen at 0.7264 which represents a key level today.
The hourly chart shows strong consolidation taking place as price whipsaws back and forth. As a result, there is currently no clear trend defined within the short term. Now, the price is set at 0.7264 to act as a daily pivot point.
It should be noted that volatility is very high for that the AUD/USD pair is still moving between 0.7264 and 0.7341 in coming days. Furthermore, the price has set above the strong support at the levels of 0.7264 and 0.7244, which coincides with the 61.8% and 50% Fibonacci retracement level respectively.
Additionally, the price is in a bullish channel now. Amid the previous events, the pair is still in a uptrend. From this point, the AUD/USD pair is continuing in a bullish trend from the new support levels of 0.7264 or/and 0.7244.
Moreover, the RSI is becoming to signal an upward trend, as the trend is still showing strong above the moving average (100). Thus, the market is indicating a bullish opportunity above the area of 0.7264 and 0.7244.
The price spot of 0.7264 and 0.7244remains a significant support zone. Hence, a possibility that the AUD/USD pair will have upnside momentum is rather convincing and the structure of a rise does not look corrective. In order to indicate a bearish opportunity above 0.7264 and 0.7244.
If the pair fails to pass through the levels of 0.7264 and 0.7244, the market will indicate a bullish opportunity above the strong support levels of 0.7264 and 0.7244.
In this regard, buy deals are recommended higher than the 0.7264 level with the first target at 0.7341. It is possible that the pair will turn upwards continuing the development of the bullish trend to the level 0.7264 .
Consequently, buy above the level of 0.7264 with the first target at 0.7341 so as to test the daily resistance 1 and further to 0.7375. Besides, the level of 0.7405 is a good place to take profit.
However, stop loss has always been in consideration thus it will be useful to set it below the last double bottom at the level of 0.7220 (last bearish wave).
Dzięki analizom InstaForex zawsze będziesz na bieżące z trendami rynkowymi! Zarejestruj się w InstaForex i uzyskaj dostęp do jeszcze większej liczby bezpłatnych usług dla zyskownego handlu.

