 Anuluj
Warunki handlowe
Narzędzia


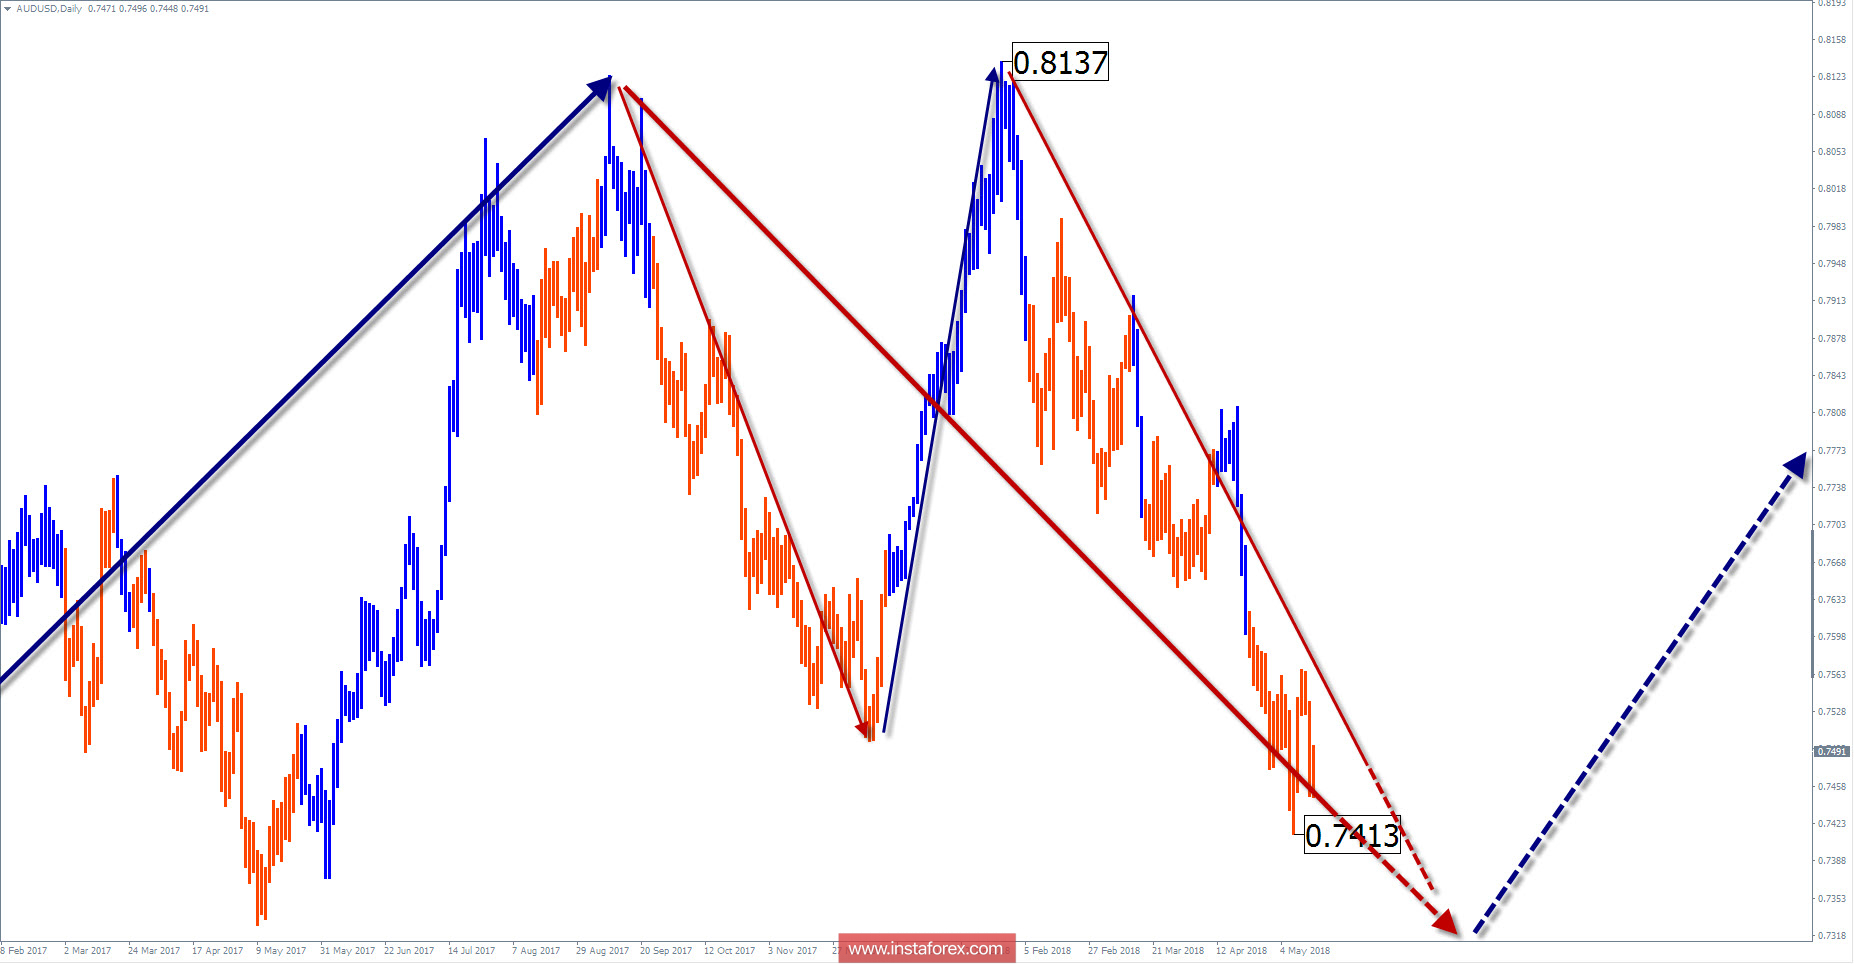
Wave picture of the chart D1:
Since January 2016, the main vector of the price movement of the major pair has been the upward movement. In a larger wave formation, the site occupies the place of correction. In the structure of the wave since September last year, the middle part (B) is formed.
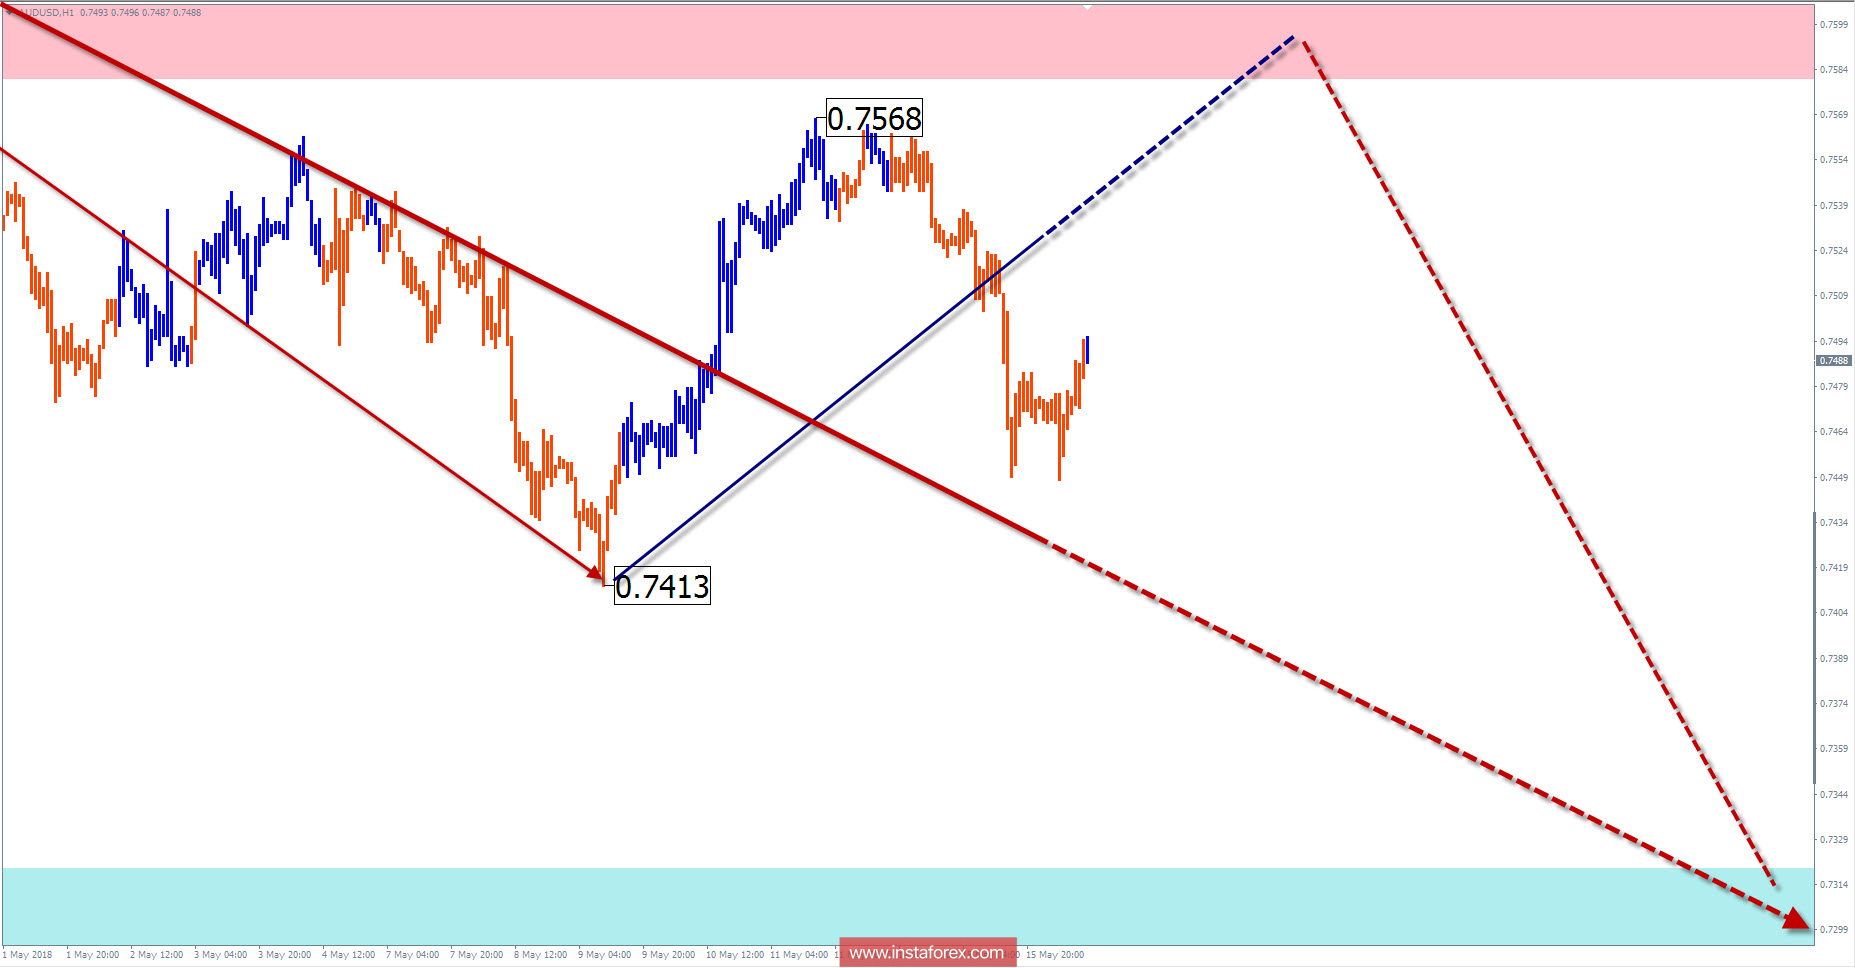
The wave pattern of the graph H1:
The bearish wave sets the main direction since the end of January. The reduction potential is not exhausted for today. Estimated support shows the upper boundary of the target reduction zone.
The wave pattern of the M15 chart:
The direction of the daily flow is set by the bullish wave of May 9. The final part has not been completed in the zigzag structure.
Recommended trading strategy:
Purchases are premature, you must wait for the current wave to end. In short-term trading in the resistance zone, you should look for signals for the sale of the pair.
Resistance zones:
- 0.7580 / 0.7630
Support zones:
- 0.7320 / 0.7270
Explanations to the figures: Simplified wave analysis uses a simple waveform, in the form of a 3-part zigzag (ABC). At each TF the last incomplete wave is analyzed. Zones show the calculated areas with the greatest probability of a turn.
Arrows indicate the wave counting according to the technique used by the author. The solid background shows the generated structure, dotted - the expected wave motion.
Attention: The wave algorithm does not take into account the duration of the tool movements in time. To conduct a trade transaction, you need confirmation signals from your trading systems!
Dzięki analizom InstaForex zawsze będziesz na bieżące z trendami rynkowymi! Zarejestruj się w InstaForex i uzyskaj dostęp do jeszcze większej liczby bezpłatnych usług dla zyskownego handlu.

