 Anuluj
Warunki handlowe
Narzędzia


4-hour timeframe
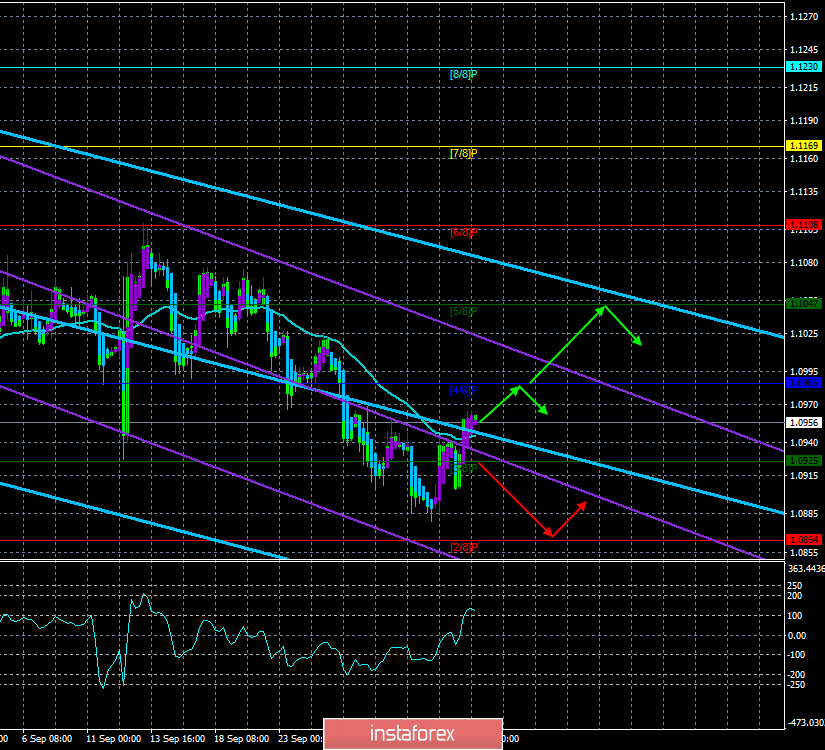
Technical data:
The upper channel of linear regression: direction – down.
The lower channel of linear regression: direction – down.
The moving average (20; smoothed) – sideways.
CCI: 119.6726
The fourth trading day for the EUR/USD currency pair began with overcoming the moving average line. Thus, the trend has changed at the moment to an upward one in the short term. The euro can breathe calmly, as it is not expected to fall again shortly. At the same time, bears should not relax because the euro often surprisingly receives new fundamental reasons for the fall.
Today, October 3, the European Union and the United States will publish indices of business activity in services, as well as composite indices of business activity. We remember how "good" were the indexes of business activity in the manufacturing sector, published on Monday. In the service sector, things are a little better, but this does not mean that the sphere does not experience any problems. Previously, Mario Draghi has already stated that the problem sphere of production can "pull along" other spheres. According to experts, the European index will be 52.0. Having studied the data for the last years, we can say that the index has never fallen below 50.0 for 5 years, and the usual and normal value for it is 53.0 and above. Thus, although it is too early to talk about the decline in the EU services sector, the indicator is slowly sliding to a critical point. In the US, business activity in the services sector is a little better. The key ISM index is projected at 55.1 and implies a slight decline from 56.4. The second indicator – Markit – is ready to fall to 50.9, which is dangerously close to 50.0. In general, these indicators will be the most interesting for market participants today. We, as before, believe that the economic situation in the United States remains stronger, so we expect a slowdown in business activity in the eurozone and the United States, but in the eurozone, we believe that the slowdown will be stronger and weaker indicators.
In addition to the two above-mentioned indices, retail sales in the European Union will also be released today, and experts' forecasts predict another slowdown in growth to 1.9% y/y. Well, in the States, production orders for August will also come out with a forecast of -0.2%.
Now let's try to figure out what the euro/dollar currency pair needs to continue this seemingly long-awaited growth? Firstly, it is certainly the absence of outright failures with macroeconomic statistics from the European Union. Secondly, the weakest possible data from America. And we believe that with both of these conditions, the pair will have problems. However, we do not recommend traders to try to guess what will be today's macroeconomic reports, it is better to follow the general trend that has formed in the market. It is best to return to sales based on it after the pair has re-attached below the moving average line.
Nearest support levels:
S1 –1.0925
S2 – 1.0864
S3 – 1.0803
Nearest resistance levels:
R1 – 1.0986
R2 – 1.1047
R3 – 1.1108
Trading recommendations:
The euro/dollar pair continues its corrective movement, already above the moving average. Thus, the bears are still recommended to wait for the completion of the correction and resume selling the euro with the target of Murray's level of "2/8" – 1.0864 after the reverse consolidation below the moving average. Purchases of the pair can formally be considered very small lots now with a target of 1.0986.
In addition to the technical picture, fundamental data and the time of their release should also be taken into account.
Explanation of the illustrations:
The upper channel of linear regression – the blue lines of the unidirectional movement.
The lower channel of linear regression – the purple lines of the unidirectional movement.
CCI – the blue line in the indicator window.
The moving average (20; smoothed) – the blue line on the price chart.
Support and resistance – red horizontal lines.
Heiken Ashi – an indicator that colors bars in blue or purple.
Dzięki analizom InstaForex zawsze będziesz na bieżące z trendami rynkowymi! Zarejestruj się w InstaForex i uzyskaj dostęp do jeszcze większej liczby bezpłatnych usług dla zyskownego handlu.


