 Anuluj
Warunki handlowe
Narzędzia


The price in January, moving down, tested the 21 average EMA - 1.2943 (black thin line) and after that, the pair went up. In turn, the news played a significant role in the upward movement.
In February, an upward movement is possible with the target of 1.3514 - the upper fractal (red dashed line). In case of breaking through this level, the next upper target is the pullback level of 76.4% - 1.3759 (blue dashed line). The reference point will be the level of 1.3223 - resistance line (black bold line).
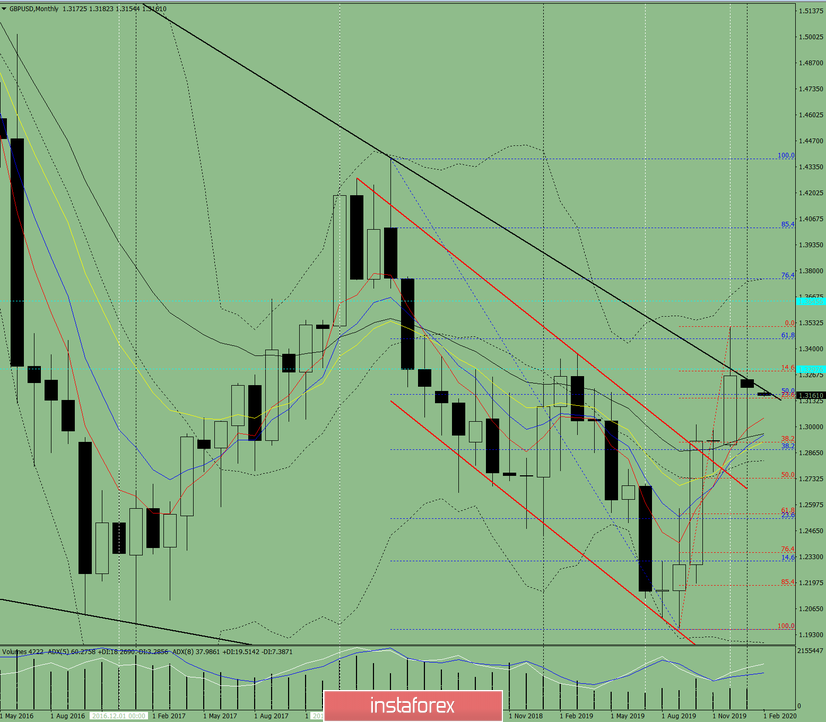
Fig. 1 (monthly chart).
Indicator Analysis:
- indicator analysis - up;
- Fibonacci levels - up;
- volumes - up;
- candlestick analysis - down;
- trend analysis - up;
- Bollinger Lines - up;
The conclusion of a comprehensive analysis is most likely working at the top.
The total result of calculating the candle of the GBP / USD currency pair according to the monthly chart: the price will most likely have an upward trend with the absence of the first lower shadow (the first week of the month is white) and the absence of the second upper shadow (the last week is white).
The upper target is 1.3514 which is upper fractal (red dashed line). In case of breaking through this level, the next upper target is the pullback level of 76.4% - 1.3759 (blue dashed line).
An unlikely scenario: a downward movement with the target 1.2919 - pullback level 38.2% (red dashed line) from the level of 1. 3223 resistance line (black bold line).
Dzięki analizom InstaForex zawsze będziesz na bieżące z trendami rynkowymi! Zarejestruj się w InstaForex i uzyskaj dostęp do jeszcze większej liczby bezpłatnych usług dla zyskownego handlu.


