 Anuluj
Warunki handlowe
Narzędzia


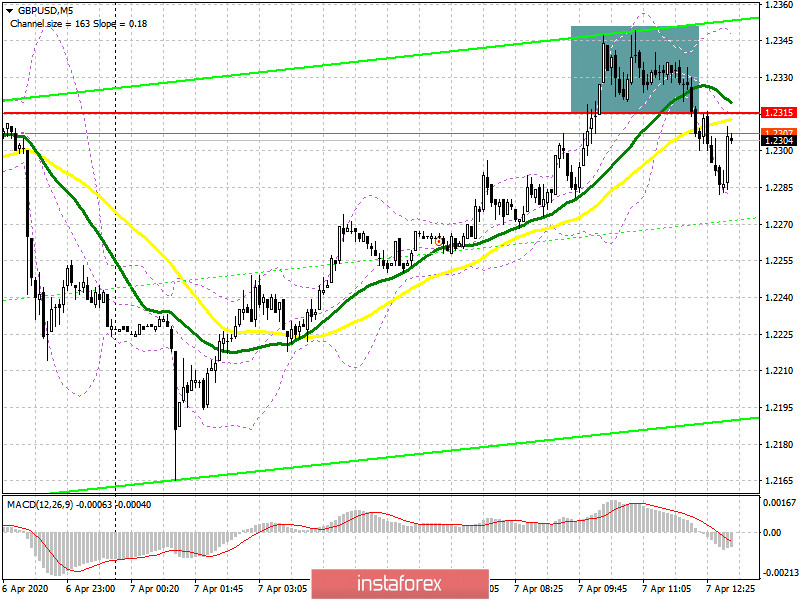
To open long positions on GBPUSD, you need:
In the morning forecast, I paid attention to the level of 1.2315, the breakdown of which was supposed to lead to a larger upward trend of the British pound. If we look at the 5-minute chart, we can see that the bulls managed to gain a foothold above this resistance for a while, and it was quite possible to count on the continuation of the upward correction, but support from major players was not received, which led to a decline in the GBP/USD to the level of 1.2315, where trading is currently being conducted. This situation adds even more uncertainty in the future direction. In the second half of the day, the bulls will need a second breakthrough of the resistance of 1.2315, which will lead to a larger upward correction of the pair to the area of last week's maximum of 1.2473, where I recommend fixing the profits. It is important to note that if the bulls manage to close the day above 1.2315 – this will be a very strong bullish signal in the medium term, which will open a direct path to new highs in the area of 1.2605 and 1.2686. In the scenario of a decline in GBP/USD, you can still count on long positions only after the formation of a false breakout from the support of 1.2150 or buy the pound immediately on a rebound from the minimum of 1.1985.
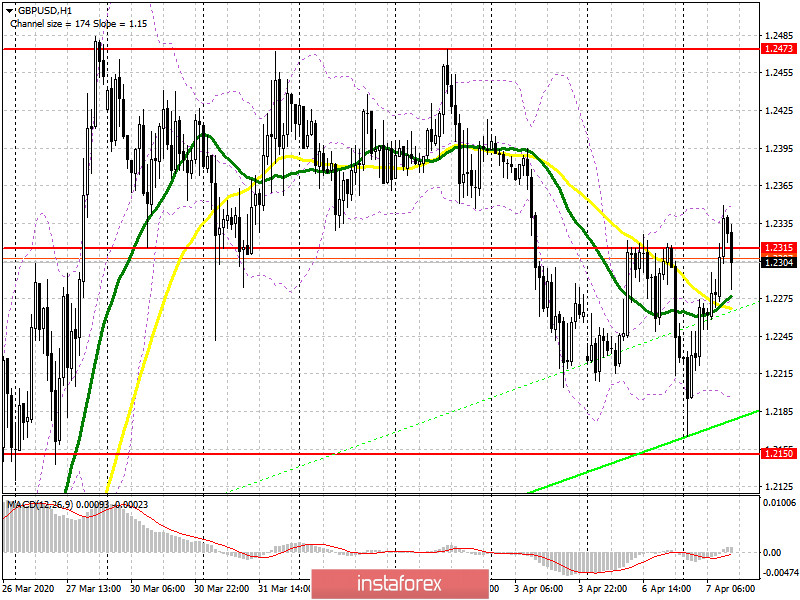
To open short positions on GBPUSD, you need:
Like yesterday, there is no special activity of bears at the level of 1.2315, but there are also no people willing to buy the pound. If yesterday the pressure on the GBP/USD turned out to be news about the deterioration of the health of British Prime Minister Boris Johnson, it is not very clear what to expect today for the bears. Important fundamental statistics on the state of the American economy are not published today. In the second half of the day, the bears need to hold the pair below the resistance of 1.2315, which will necessarily lead to a repeated decline to the low of 1.2150. It will also be important to update the low of yesterday, since only under this condition can we talk about maintaining the bearish trend, which will quickly lead GBP/USD to the support of 1.1985, where I recommend fixing the profits. In the scenario of the pound rising above the resistance of 1.2315, it is best to return to short positions on the rebound from the maximum of 1.2473, or after updating the larger resistance of 1.2605, counting on correction of 50-60 points within the day.
Signals of indicators:
Moving averages
Trading is conducted just above the 30 and 50 daily averages, which indicates the advantage of buyers over sellers.
Note: The period and prices of moving averages are considered by the author on the hourly chart H1 and differ from the general definition of the classic daily moving averages on the daily chart D1.
Bollinger Bands
A break in the upper limit of the indicator around 1.2320 will lead to an increase in the pound. Support will be provided by the lower border around 1.2200.
Description of indicators
Dzięki analizom InstaForex zawsze będziesz na bieżące z trendami rynkowymi! Zarejestruj się w InstaForex i uzyskaj dostęp do jeszcze większej liczby bezpłatnych usług dla zyskownego handlu.


