 Anuluj
Warunki handlowe
Narzędzia


To open long positions on EUR/USD, you need:
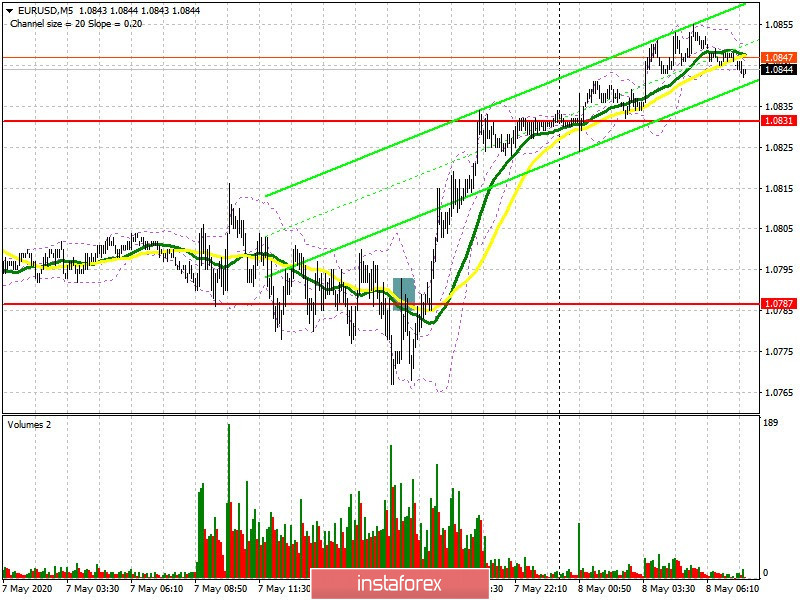
To get started, let's go over yesterday's deals that were formed in the afternoon. I have repeatedly paid attention to the breakout of support 1.0787 and counted on further movement down from this level. If you look at the 5-minute chart, you can see how the bears manage to break below 1.0787 and even make a test from bottom to top on the volume, which allows us to expect the euro's fall. However, the repeated return to the day's low dampened the bearish momentum, as a result of which the pair returned to 1.0787, from which the euro sharply rose. Currently, all attention will be focused on the report Non-Farm Employment Change and the speech of the President of the European Central Bank Christine Lagarde. If the bulls manage to form a false breakout in the support area of 1.0826 in the morning, then you can look at long positions in continuing growth. If there is no activity at the 1.0826 area, it is best to postpone purchases until the test of a larger low of 1.0771, counting on a correction of 30-35 points within the day. An equally important goal of buyers to maintain an upward correction will be updating the high of 1.0882, consolidating above which will lead to larger growth in the area of 1.0923, where I recommend taking profits.
To open short positions on EUR USD you need:
The US labor market data is unlikely to lead to serious changes in the market, since similar statistics have recently been ignored by traders. If the report does not go beyond the forecasts of economists, trade may remain in the side channel. The bears will try to return to 1.0826 in the first half of the day, but I recommend opening short positions from it only after consolidating below this range with a test, for example, which I outlined yesterday on the 5-minute chart. In this scenario, the key weekly target for sellers will be the low of 1.0771, where I recommend taking profits. If the bulls continue to push the market up, it is best to return to short positions only on the rebound from the resistance of 1.0882 or sell EUR/USD from a larger high of 1.0923 while expecting a decrease of 30-35 points within the day.
Signals of indicators:
Moving averages
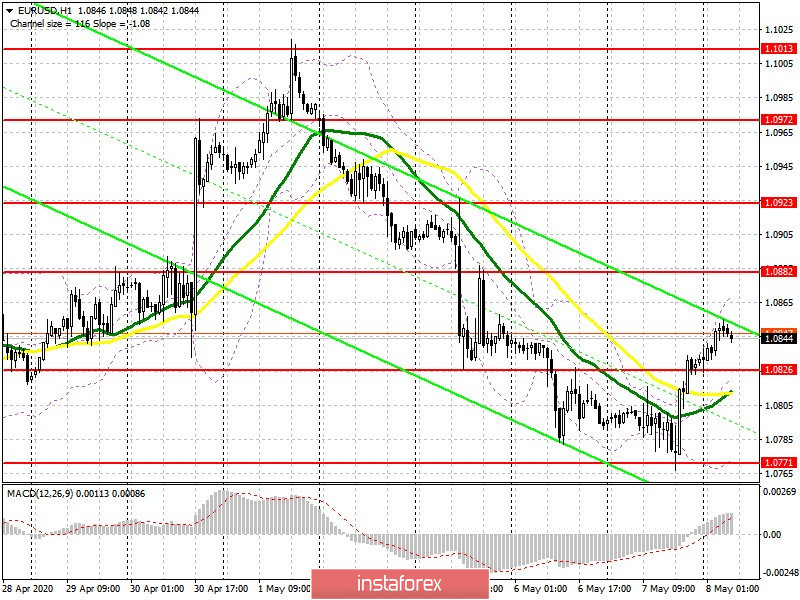
Trading is above 30 and 50 moving averages, which indicates the likelihood of the completion of a bearish impulse.
Note: The period and prices of moving averages are considered by the author on the hourly chart H1 and differs from the general definition of the classic daily moving averages on the daily chart D1.
Bollinger bands
A break of the upper border of the indicator in the region of 1.0875 can lead to a sharp increase in the euro. In case the pair falls, the average border of the indicator in the area of 1.0826 will act as support, and you can buy the euro by rebounding from the lower border in the area of 1.0780.
Description of indicators
Dzięki analizom InstaForex zawsze będziesz na bieżące z trendami rynkowymi! Zarejestruj się w InstaForex i uzyskaj dostęp do jeszcze większej liczby bezpłatnych usług dla zyskownego handlu.


