 Anuluj
Warunki handlowe
Narzędzia


The EUR/USD pair broke through the support line 1.0800 (blue bold line), moved up and almost tested the upper fractal of 1.1017 (blue dashed line) last week. After that, it went down 107 points. The price may continue to move up in the coming week.
Trend analysis.
This week, the price from the pullback level of 61.8% - 1.0860 (red dashed line) can continue to move up with the first target at 1.1017 - the upper fractal (blue dashed line). After reaching this level, the price will continue to move up to the next upper target at 1.1082 - historical resistance level (blue horizontal dotted line).
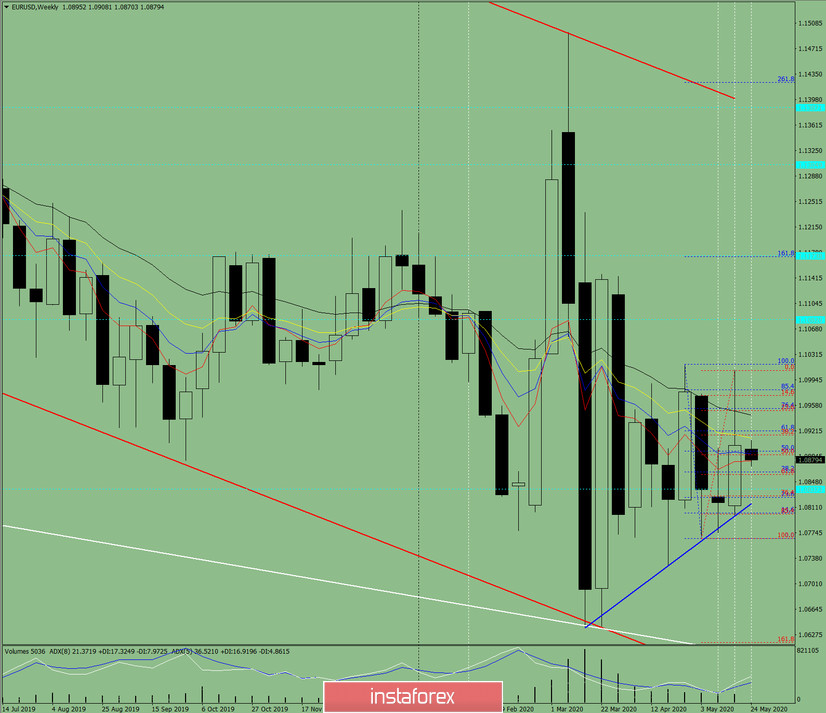
Fig. 1 (weekly schedule).
Comprehensive analysis:
- indicator analysis - up;
- Fibonacci levels - up;
- volumes - up;
- candlestick analysis - neutral;
- trend analysis - up;
- Bollinger Lines - down;
- monthly chart - up.
The conclusion of a comprehensive analysis is an upward movement.
The overall result of calculating the candle of the EUR/USD currency pair according to the weekly chart: the price of the week is likely to have an upward trend, with the presence of a lower shadow for the weekly white candlestick (Monday - down) and the absence of a second upper shadow (Friday - up).
The upper weekly target is 1.1082 - a historical resistance level (blue horizontal dashed line).
An unlikely lower scenario: the price from the pullback level of 61.8% - 1.0860 (red dotted line) will move down, with the first target at 1.0816 support line (blue bold line) and only then will develop upwards.
Dzięki analizom InstaForex zawsze będziesz na bieżące z trendami rynkowymi! Zarejestruj się w InstaForex i uzyskaj dostęp do jeszcze większej liczby bezpłatnych usług dla zyskownego handlu.

