 Anuluj
Warunki handlowe
Narzędzia


To open long positions on EUR/USD, you need:
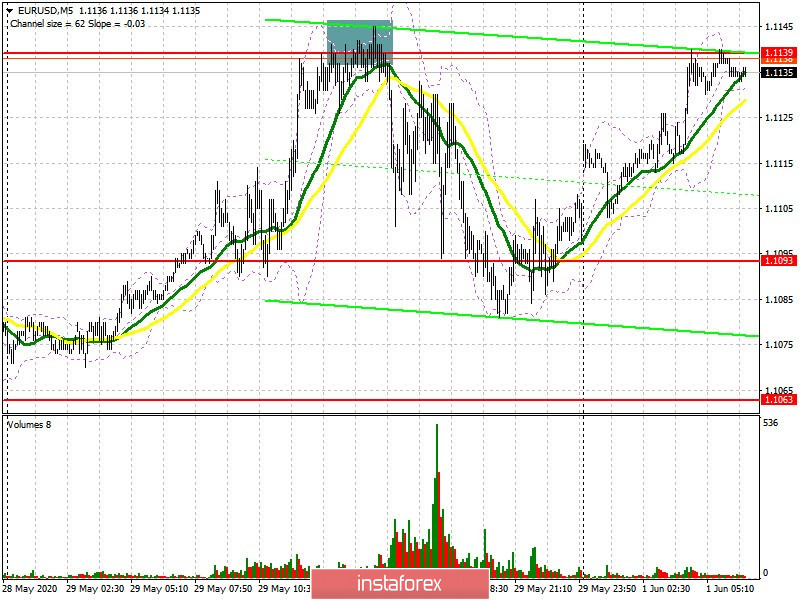
I paid special attention to resistance 1.1139 on Friday afternoon, near which the upward movement of the European currency slowed down. Forming a false breakout there was a direct signal to open short positions. If you look at the 5-minute chart, you can see how the bulls tried to return to the market several times, but failed to gain a foothold at 1.1139, which resulted in profit taking by the end of the week. The technical picture has not changed much at the moment, and trading continues to be conducted around the 1.1139 level. Further movement will depend on data on production activity in the eurozone, as well as on whether the bulls will be able to gain a foothold above the 1.1139 range or not. After a successful breakout, I recommend continuing to open long positions above this resistance with the main goal of updating the high of 1.1183 and reaching a larger level of 1.1231, where you can take profits. If there is no active EUR/USD growth above 1.1139 in the morning, it is best to postpone purchases and wait for the euro to correct in the support area of 1.1085 or open long positions immediately to rebound from larger lows of 1.1034 and 1.0994.
To open short positions on EUR/USD, you need:
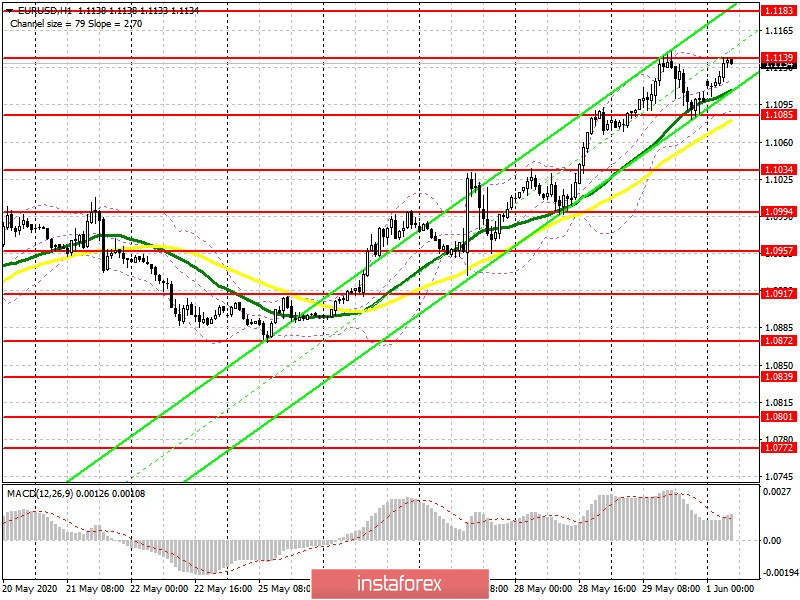
Sellers have once again tried to stop the bull market today in the Asian session and are actively not letting the pair go above resistance 1.1139. Now the bears need to wait for the fundamental statistics on the eurozone to come out, as well as form a false breakout in the area of this resistance, which will be the first signal to open short positions, the goal will be to support 1.1085. However, consolidating below this level will result in a sell-off of EUR/USD to the area of lows 1.1034 and 1.0994, where I recommend taking profits. In case the euro grows further in the first half of the day, it is best to return to short positions to rebound from a high of 1.1183 or even higher, from a larger resistance 1.1231, based on a correction of 20-30 points by the end of the day. It is also worth paying attention to divergence, which can be clearly traced back from the Friday level. If the divergence on the MACD indicator persists after updating last week's high, this will also be an additional signal to open short positions.
Signals of indicators:
Moving averages
Trade is conducted above 30 and 50 moving averages, which indicates continued growth of the euro in the short term.
Note: The period and prices of moving averages are considered by the author on the hourly chart H1 and differs from the general definition of the classic daily moving averages on the daily chart D1.
Bollinger bands
The upper border of the indicator in the area of 1.1139 will act as resistance, a break through which will lead to a new wave of euro growth. In case the euro falls, the lower border in the area of 1.1085 will support.
Description of indicators
Dzięki analizom InstaForex zawsze będziesz na bieżące z trendami rynkowymi! Zarejestruj się w InstaForex i uzyskaj dostęp do jeszcze większej liczby bezpłatnych usług dla zyskownego handlu.


