 Anuluj
Warunki handlowe
Narzędzia


Trend analysis (Fig. 1).
Today, the upward trend may continue from the level of 1.2598 (closing of yesterday's candle) with the target level at the resistance level of 1.2650 (presented in a red dotted line). It is unlikely to break through this level, however, the price may begin to move downward with the first target at 1.2580 (presented in a red dashed line).
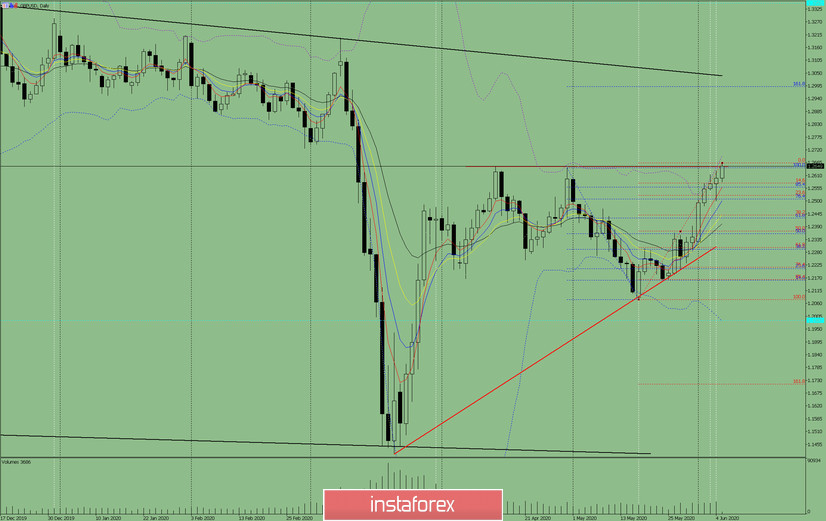
Fig. 1 (daily chart).
Comprehensive analysis:
- Indicator analysis - down;
- Fibonacci levels - down;
- Volumes - down;
- Candlestick analysis - down strongly;
- Trend analysis - down;
- Bollinger Lines - down;
- Weekly schedule - down.
General conclusion:
Today, the price may move downward from the level of 1.2650 (presented in a red bold line) with the target of 1.2579 - a 14.6% pullback level (presented in a red dashed line). Upon breaking through this level, the downward movement may continue with the next target of 1.2525 - a 23.6% retracement level (presented in a red dashed line).
Another possible scenario is an upward trend upon breaking through the resistance level of 1.2650 (presented in a red bold line). Upon reaching this level, the upward trend may continue with the next target of 1.2992 - a 161.8% price level (presented in a blue dashed line).
Dzięki analizom InstaForex zawsze będziesz na bieżące z trendami rynkowymi! Zarejestruj się w InstaForex i uzyskaj dostęp do jeszcze większej liczby bezpłatnych usług dla zyskownego handlu.


