 Anuluj
Warunki handlowe
Narzędzia


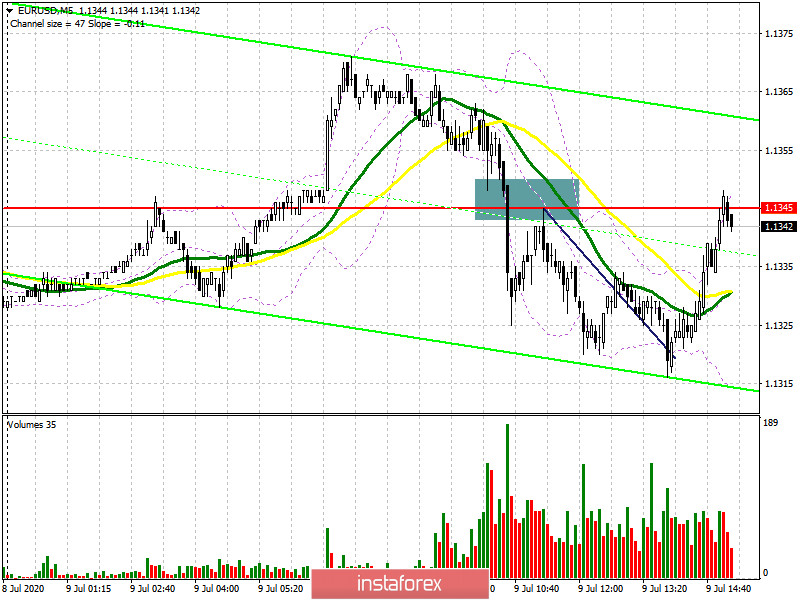
To open long positions on EURUSD, you need:
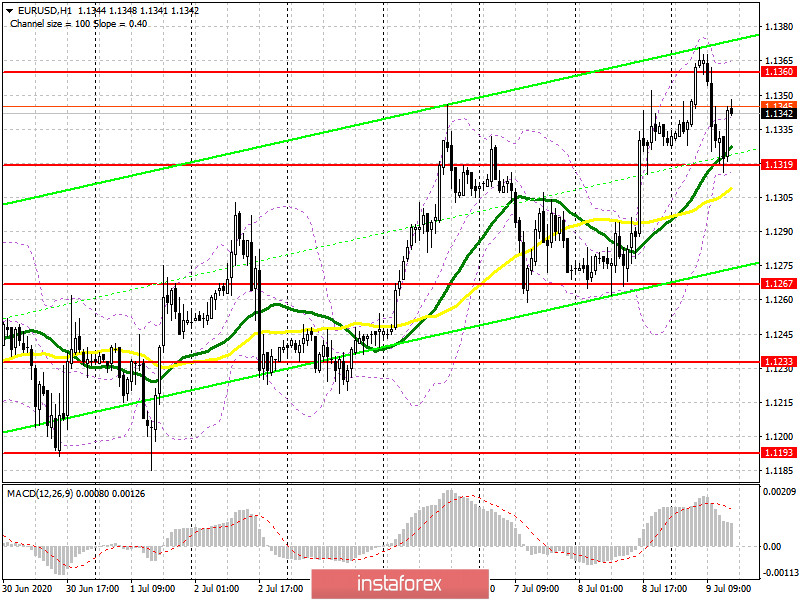
The lack of fundamental statistics in the first half of the day did not allow euro buyers to hold above the rather important level of 1.1345, which served as a support in the first half of the day. On the 5-minute chart, you can clearly see how the bears broke below this range at the first attempt, and the entry point was a repeated test of this level from the bottom up, which brought about 20-25 points of intraday profit, which is half of the total volatility of the day. This is the scenario I drew attention to in my morning forecast. At the moment, traders will focus on data on the US labor market, however, it is worth paying attention to the change in the technical picture of the pair. On the hourly chart, a new resistance of 1.1360 is formed, a breakout and consolidation above which will be the key task of euro buyers for the second half of the day. Only then can you open new long positions in the expectation of continuing the upward trend to the highs of 1.1395 and 1.1430, where I recommend fixing the profits. If the bears push the pair back to the support area of 1.1319, I recommend returning from there to long positions only after forming a false breakout. Larger buyers will wait for the update of the area of 1.1267, where the lower border of the current ascending channel formed on July 1 of this year just passes.
To open short positions on EURUSD, you need:
Sellers need to protect the resistance of 1.1360, which the pair is currently aiming for. Weekly data on the US labor market is unlikely to lead to drastic changes in the market, so the formation of a false breakout at the level of 1.1360 will be a signal to open short positions in the expectation of a repeated decline to the support of 1.1319. Only fixing below this range will increase the pressure on EUR/USD, which will lead to a larger sale in the area of the low of 1.1267, where the lower border of the current ascending channel passes. If there is no activity from the bears at the level of 1.1360, it is best not to rush with sales, but wait for the update of the maximum in the area of 1.1395, from where you can open short positions immediately for a rebound in the expectation of a correction of 20-25 points within the day.
Signals of indicators:
Moving averages
Trading is conducted just above the 30 and 50 daily moving averages, which now perform a certain role of support.
Note: The period and prices of moving averages are considered by the author on the hourly chart H1 and differ from the general definition of the classic daily moving averages on the daily chart D1.
Bollinger Bands
Breaking the lower border of the indicator in the area of 1.1319 will increase pressure on the euro. Growth above the upper limit in the area of 1.1360 will lead to bullish momentum.
Description of indicators
Dzięki analizom InstaForex zawsze będziesz na bieżące z trendami rynkowymi! Zarejestruj się w InstaForex i uzyskaj dostęp do jeszcze większej liczby bezpłatnych usług dla zyskownego handlu.


