 Anuluj
Warunki handlowe
Narzędzia


Trend analysis.
This week, the price from the level of 1.1299 (closing of the last weekly candle) can begin to decline, with the first target 1.1268 - a pullback level of 50.0% (blue dashed line). Upon reaching this level, it is possible to further work down with the next target 1.1245 - a pullback level of 61.8% (blue dashed line). From this line, the development may begin upward.
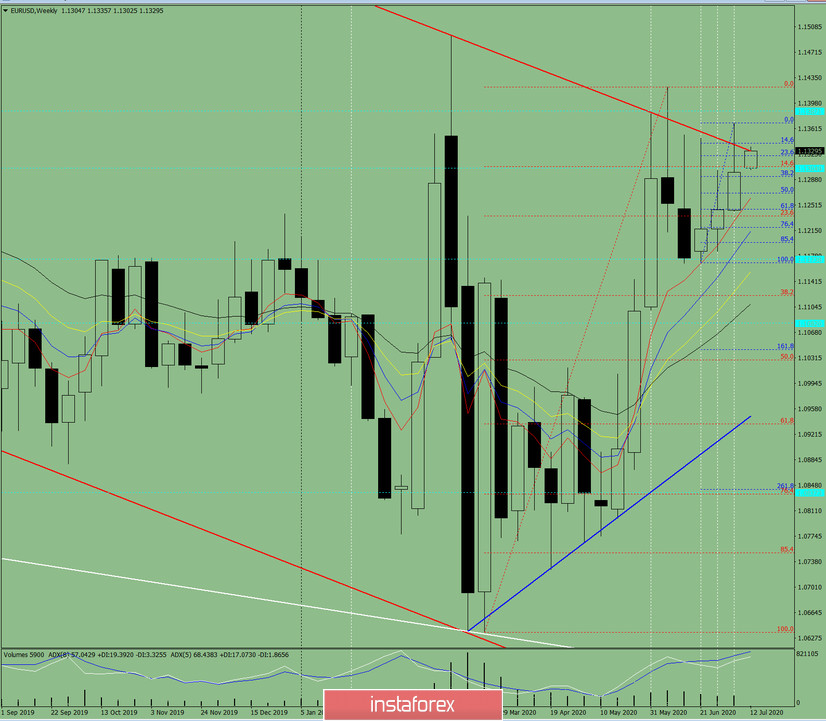
Fig. 1 (weekly schedule).
Comprehensive analysis:
- indicator analysis - down;
- Fibonacci levels - down;
- volumes - down;
- candlestick analysis - down;
- trend analysis - down;
- Bollinger Lines - down;
- monthly chart - up.
The conclusion of a comprehensive analysis is a downward movement.
The overall result of calculating the candle of the EUR/USD currency pair according to the weekly chart: the price of the week is likely to have a downward trend with the presence of the upper shadow of the weekly black candlestick (Monday - up) and the presence of a second lower shadow (Friday - up).
The first lower target of 1.1268 is a pullback level of 50.0% (blue dashed line). Upon reaching this level, it is likely to further work down with the next target 1.1245 - a pullback level of 61.8% (blue dashed line). From this line, the development may begin upward.
An unlikely scenario: moving down and reaching a pullback level of 50.0% - 1.1268 (blue dashed line), and then working up with the target 1.1328 - resistance line (red bold line) is unlikely.
Dzięki analizom InstaForex zawsze będziesz na bieżące z trendami rynkowymi! Zarejestruj się w InstaForex i uzyskaj dostęp do jeszcze większej liczby bezpłatnych usług dla zyskownego handlu.

