 Anuluj
Warunki handlowe
Narzędzia


Hourly chart of the EUR/USD pair
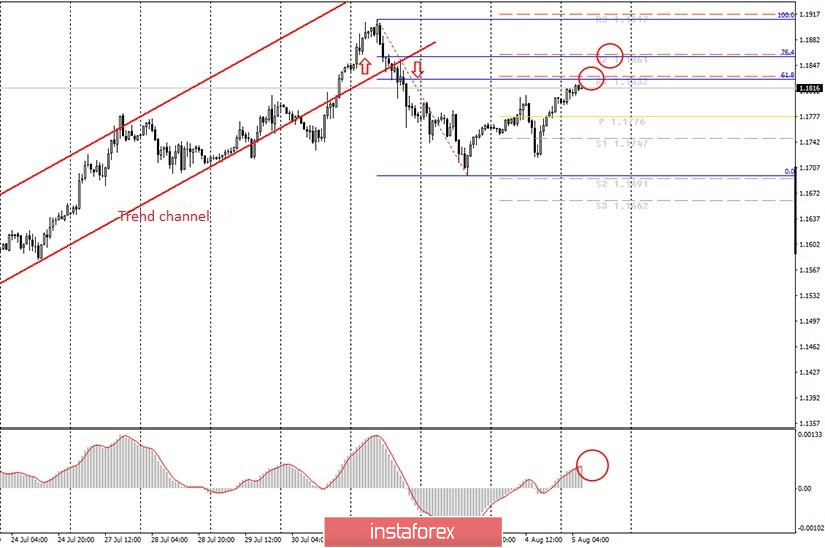
The EUR/USD pair made another, absolutely unsuccessful attempt to continue moving down on Tuesday. However, having gone down only 70 points and not even reaching the first target from yesterday, sellers retreated and the US dollar began to fall again. Thus, from our point of view, the downward movement is still more promising. For several reasons. Among the technical reasons, we still highlight the need for correction. In total, the euro/dollar pair went down 209 points at the moment, and before that up - 700. That is, the current size of the correction is frankly small. At the same time, we assume that the sellers allowed the pair to pull back and today they will start selling it with renewed vigor. To do this, we have built a grid of Fibonacci levels, which shows that the current retracement size is 61.8%. Around this level, or about 76.4%, we expect the pair to reverse down and fall to at least 1.1747. Potential rebound and reversal locations are marked with circles.
Novice traders could not safely open the calendar of economic events on Tuesday, as it was empty. The situation will be much more interesting today. First, there will be PMIs in the service sectors in European countries and the European Union as a whole, later - retail sales in the EU, and PMIs in the US services sector and the ADP report on changes in the number of employees in the private sector in the afternoon. We advise traders to focus on only two reports. The first is the change in retail sales in the EU. This indicator is important because it shows how consumer spending has changed (increased or decreased during the reporting period). If they grow, it is good for the economy; if not, it is bad. The forecast speaks of a reduction of 0.5% in June, which can hardly be considered a positive moment. The second is the ADP report, which will show how the number of workers in America has changed. The forecast is +1.5 million, which at first glance seems to be a pretty good value. However, after the number of employees dropped by 23 million in May and June, the +1.5 million does not look solid. Therefore, we believe that the macroeconomic background will be neutral today.
The following scenarios are possible on August 5:
1) Purchases are no longer relevant since the price has left the ascending channel. Thus, in order to trade the EUR/USD pair upward, new technical constructions are now needed (trend lines, channels, triangles, and others). There are none now, so novice traders can trade the pair up at their own peril and risk. The last upward reversal of the MACD indicator gave a signal with the 1.1832 target, and at the moment the pair went up about 40 points after it formed.
2) Selling the currency pair is much more promising now, so we recommend waiting for the MACD indicator to turn down around the levels of 1.1827 (61.8%) and 1.1858 (76.4% Fibonacci), and then open new sales with a target of 1.1747. If a rebound from the indicated levels does not happen and they are overcome, then the option of selling the pair is canceled for today.
What's on the chart:
Support and Resistance Price Levels - Levels that are targets when buying or selling. You can place Take Profit levels near them.
Red lines - channels or trend lines that display the current trend and show which direction it is preferable to trade now.
Arrows up/down - indicate when you reach or overcome which obstacles you should trade up or down.
MACD indicator is a histogram and a signal line, the crossing of which is a signal to enter the market. It is recommended to use in combination with trend lines (channels, trend lines).
Important speeches and reports (always contained in the news calendar) can greatly influence the movement of a currency pair. Therefore, during their exit, it is recommended to trade as carefully as possible or exit the market in order to avoid a sharp price reversal against the previous movement.
Beginners in the forex market should remember that every trade cannot be profitable. The development of a clear strategy and money management are the key to success in trading over a long period of time.
Dzięki analizom InstaForex zawsze będziesz na bieżące z trendami rynkowymi! Zarejestruj się w InstaForex i uzyskaj dostęp do jeszcze większej liczby bezpłatnych usług dla zyskownego handlu.

