 Anuluj
Warunki handlowe
Narzędzia


Trend analysis (Fig. 1).
The market may continue to move downward from the level of 1.1856 (closing of yesterday's daily candle) with the target at the support level 1.1791 (white thick line). From here, the price may begin to move upward with the next target at the historical resistance level of 1.1912 (blue dotted line).
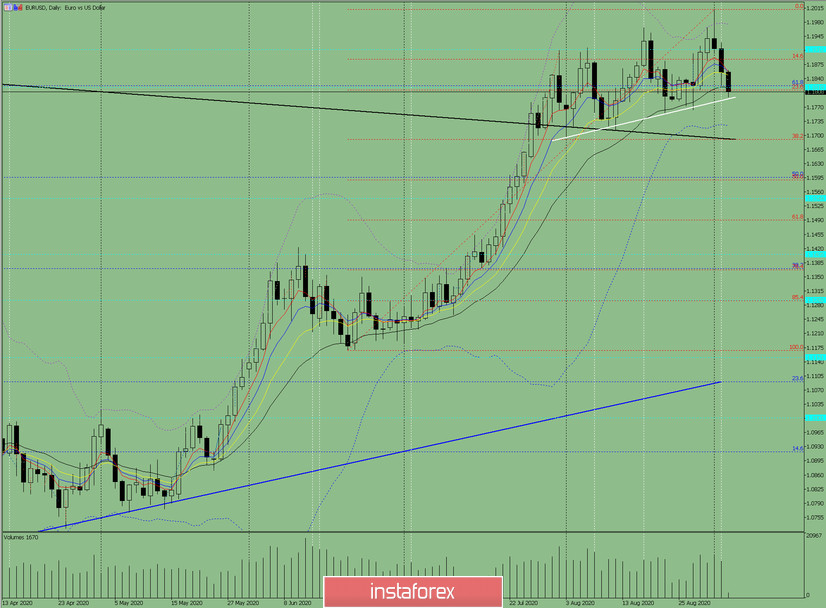
Figure: 1 (daily chart).
Comprehensive analysis:
- Indicator analysis - down;
- Fibonacci levels - down;
- Volumes - down;
- Candlestick analysis - down;
- Trend analysis - up;
- Bollinger lines - down;
- Weekly chart - down.
General conclusion:
Today, the market may continue to move downward from the level of 1.1856 (closing of yesterday's daily candle) with the target at the support level 1.1791 (white thick line). From here, the price may begin to move upward with the next target at the historical resistance level of 1.1912 (blue dotted line).
Another possible scenario is a downward trend and a test of the support level 1.1795 (white bold line). After this, the price may continue to move down with the next target of 1.1723 located at the lower border of the Bollinger line indicator (blue dotted line). If this level is broken down, the next target will be at the support level 1.1691 (black bold line).
Dzięki analizom InstaForex zawsze będziesz na bieżące z trendami rynkowymi! Zarejestruj się w InstaForex i uzyskaj dostęp do jeszcze większej liczby bezpłatnych usług dla zyskownego handlu.


