 Anuluj
Warunki handlowe
Narzędzia


The pair traded downward on Friday and once again tested the support level 1.1793 (white thick line) and then rolled back up. Today, the price may resume its downward movement. Nothing is expected for economic calendar news. A narrow market is expected due to the day off in the US.
Trend analysis (Fig. 1).
The market may continue to move downward from the level of 1.1840 (closing of the Friday's daily candle) with the target at the support level 1.1798 (white thick line). A test of this level may lead to a continuation of the downward trend with the target at the level of 1.1745 located at the lower border of the Bollinger Band indicator (blue dashed line).
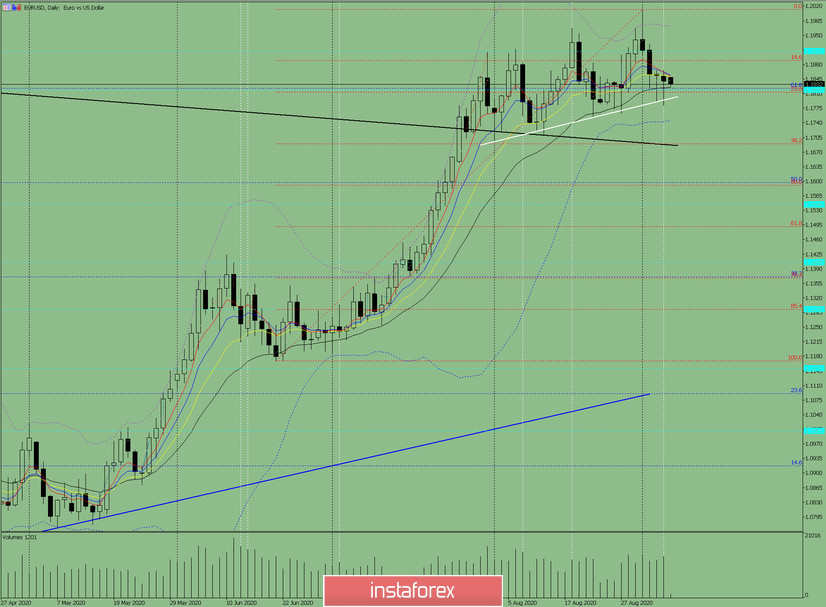
Figure: 1 (daily chart).
Comprehensive analysis:
- Indicator analysis - down;
- Fibonacci levels - down;
- Volumes - down;
- Candlestick analysis - up;
- Trend analysis - down;
- Bollinger lines - up;
- Weekly chart - down.
General conclusion:
Today, the price may move downward with the target at the support level 1.1798 (white thick line). A test of this level may lead to a continuation of the downward trend with the next target at the level of 1.1745 located at the lower border of the Bollinger Band indicator (blue dashed line).
Another possible scenario is, after testing the support level of 1.1798, the price may move upward with the target at the historical resistance level of 1.1912 (blue dashed line).
Dzięki analizom InstaForex zawsze będziesz na bieżące z trendami rynkowymi! Zarejestruj się w InstaForex i uzyskaj dostęp do jeszcze większej liczby bezpłatnych usług dla zyskownego handlu.


