 Anuluj
Warunki handlowe
Narzędzia


Trend analysis.
It is possible that the price will continue to rise in October, with the first goal at 1.1810 - the 50% pullback level (blue dashed line). If this level is broken upwards, the next upper goal will be the resistance line - 1.1966 (black bold line). There is a high probability that this resistance will be broken upwards.
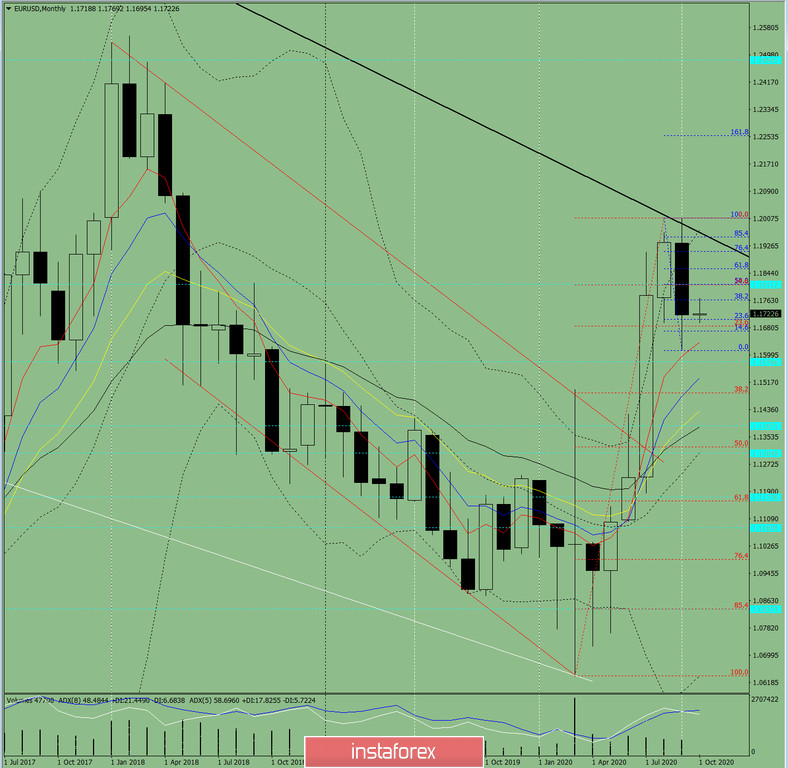
Figure: 1 (monthly chart).
Indicator analysis:
- indicator analysis - up;
- Fibonacci levels - up;
- volumes - up;
- candlestick analysis - down;
- trend analysis - up;
- Bollinger lines - down;
An upward movement can be concluded from the comprehensive analysis.
The general result of the calculation of the candlestick of the EUR/USD pair according to the monthly chart: the price will most likely have an upward trend, without the first lower shadow (the first week of the month is the upper one) in the monthly white candlestick and with the second upper shadow (the last week is black).
A general scenario: from the level of 1.1719 (closing of the September monthly candlestick), we can continue upwards to the goal at 1.1810 - a pullback level of 50% (blue dashed line).
In case of breaking this line up, the next upper goal is the resistance line located at 1.1966 (black bold line). If this line is tested, there will be a further upward movement.
An unlikely scenario: after rising and reaching the pullback level of 38.2%, 1810 (red dotted line), working below with the goal at 1.1612 lower fractal (blue dotted line) is unlikely.
Dzięki analizom InstaForex zawsze będziesz na bieżące z trendami rynkowymi! Zarejestruj się w InstaForex i uzyskaj dostęp do jeszcze większej liczby bezpłatnych usług dla zyskownego handlu.


