 Anuluj
Warunki handlowe
Narzędzia


Trend analysis
The price from the level of 1.2941 (the close of the last weekly candle) is expected to decline to the 21 average EMA - 1.2870 (black thin line) this week. If this line is reached, it can work upwards with the goal at 1.2944 - the resistance line (white thick line). Considering that the resistance line is also reached, further growth of the pair is likely.
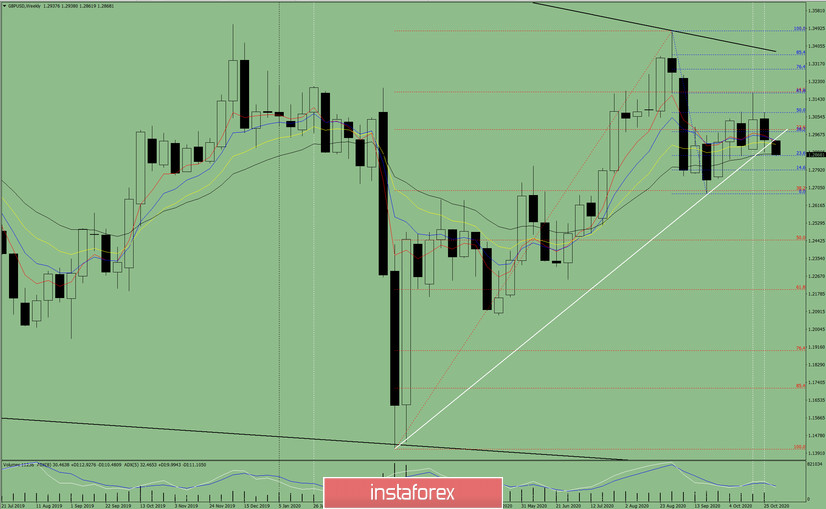
Figure 1: Weekly chart
Comprehensive analysis:
- indicator analysis - up;
- Fibonacci levels - up;
- volumes - up;
- candlestick analysis - up;
- trend analysis - up;
- Bollinger lines - up;
- monthly chart - up.
An increase in the pair can be concluded based on the comprehensive analysis.
The total calculation of candlestick of the GBP/USD pair on a weekly chart: the price is likely to have an upward trend this week, with the first lower shadow at the weekly white candle (Monday - down) and having a second upper shadow (Friday - down).
The first lower target is the 21 average EMA 1.2870 (black thin line). If this line is reached, rising towards the goal at 1.2944 - the resistance line (white thick line) can be expected. After testing the resistance line, we can continue to further increase.
An alternative scenario: the price will decline from the level of 1.2941 (closing of the last weekly candle), in order to reach the 21 average EMA - 1.2870 (black thin line). In case of reaching this line, a decline is likely in order to test the pullback level of 38.2% - 1.3175 (red dotted line).
Dzięki analizom InstaForex zawsze będziesz na bieżące z trendami rynkowymi! Zarejestruj się w InstaForex i uzyskaj dostęp do jeszcze większej liczby bezpłatnych usług dla zyskownego handlu.

