 Anuluj
Warunki handlowe
Narzędzia


Trend analysis
The price from the level of 1.1872 (closing of the last weekly candle) may further increase this week, with the first goal at 1.1908 - the 76.4% pullback level (blue dotted line).
After testing this level, the price can continue to trade upwards to the goal of 1.1951 - the pullback level of 85.4% (blue dotted line). Upon reaching this level, further growth is likely.
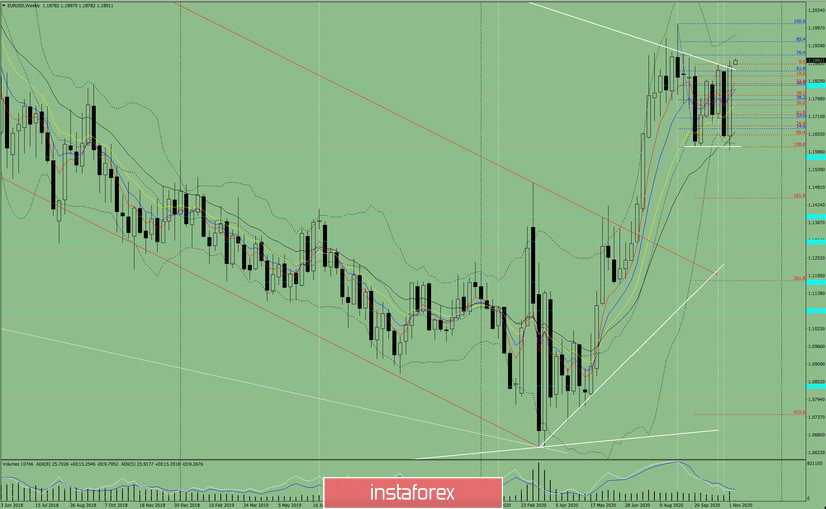
Figure 1 (weekly chart)
Comprehensive analysis:
- indicator analysis - up;
- Fibonacci levels - up;
- volumes - up;
- candlestick analysis - down;
- trend analysis - up;
- Bollinger lines - up;
- monthly chart - up.
A rise can be concluded based on comprehensive analysis.
The total result of the calculation of the candlestick of the EUR/USD pair on the weekly chart: the price is likely to have an upward trend this week, with no lower shadow in the weekly white candlestick (Monday - up) and no upper shadow (Friday - up).
The first upper goal is located at 1.1908 - 76.4% pullback level (blue dotted line). After testing this level, the price can continue to trade upwards to the goal of 1.1951 - the pullback level of 85.4% (blue dotted line). Upon reaching this level, further growth is likely.
An alternative scenario: the price can decline from the level of 1.1872 (closing of the last weekly candle), with the goal at 1.1821 - a pullback level of 23.6% (red dotted line). If this level is tested, we can move further below with the goal of 1.1779 - 38.3% pullback level (red dotted line). Upon reaching this level, rising will be considered.
Dzięki analizom InstaForex zawsze będziesz na bieżące z trendami rynkowymi! Zarejestruj się w InstaForex i uzyskaj dostęp do jeszcze większej liczby bezpłatnych usług dla zyskownego handlu.


