 Anuluj
Warunki handlowe
Narzędzia


Trend analysis (Fig. 1).
Today, from the level of 1.1915 (closing of yesterday's daily candle), the market can continue to move upward with the goal of 1.1945 - the historical resistance level (blue dotted line). When testing this level, there should be further work upward with the goal of 1.1999, which is the upper limit of the Bollinger line indicator (black dotted line). From this level, downward work is possible.
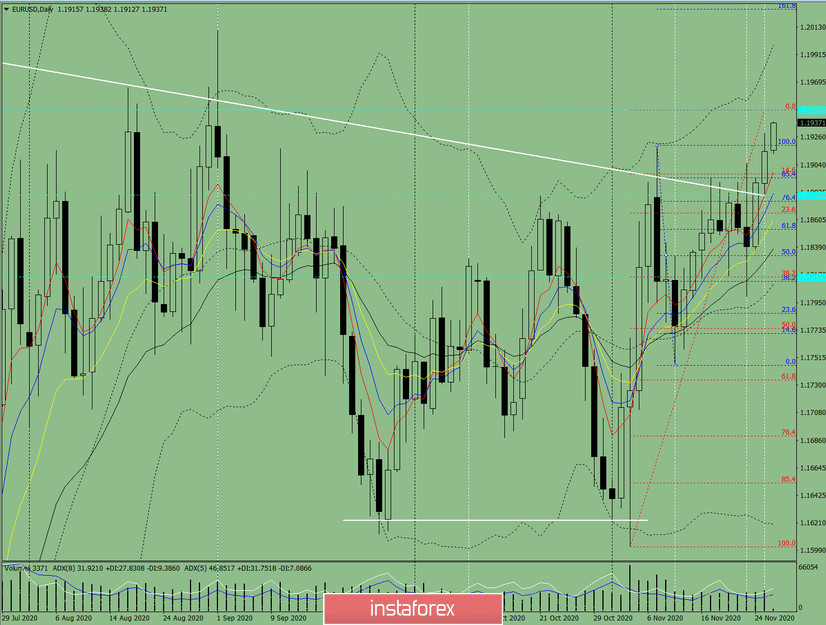
Figure 1 (Daily Chart).
Comprehensive analysis:
General conclusion:
Today, from the level of 1.1915 (closing of yesterday's daily candle), the market can continue to move upward with the goal of 1.1945 - the historical resistance level (blue dotted line). When testing this level, there should be further work upward with the goal of 1.1999, which is the upper limit of the Bollinger line indicator (black dotted line). From this level, downward work is possible.
Alternative scenario: when moving upward and testing the historical resistance level of 1.1945 (blue dotted line), the price may start moving downward with the target of 1.1897 – a 14.6% pullback level (red dotted line).
Dzięki analizom InstaForex zawsze będziesz na bieżące z trendami rynkowymi! Zarejestruj się w InstaForex i uzyskaj dostęp do jeszcze większej liczby bezpłatnych usług dla zyskownego handlu.

