 Anuluj
Warunki handlowe
Narzędzia


The pair tested the 13th average, EMA 1.3141 (yellow thin line) while declining last week, but the weekly candle closed above 1.3225 (red dotted line) – a pullback level of 14.6%. This week, the price will most likely continue to rise.
Trend analysis
The price from the level of 1.3234 (closing of the last weekly candle) is expected to rise to the first target of 1.3384 – the historical resistance level (blue dotted line). If this level is reached, it is possible to further move upwards to the target of 1.3538 - the upper fractal (red dashed line).
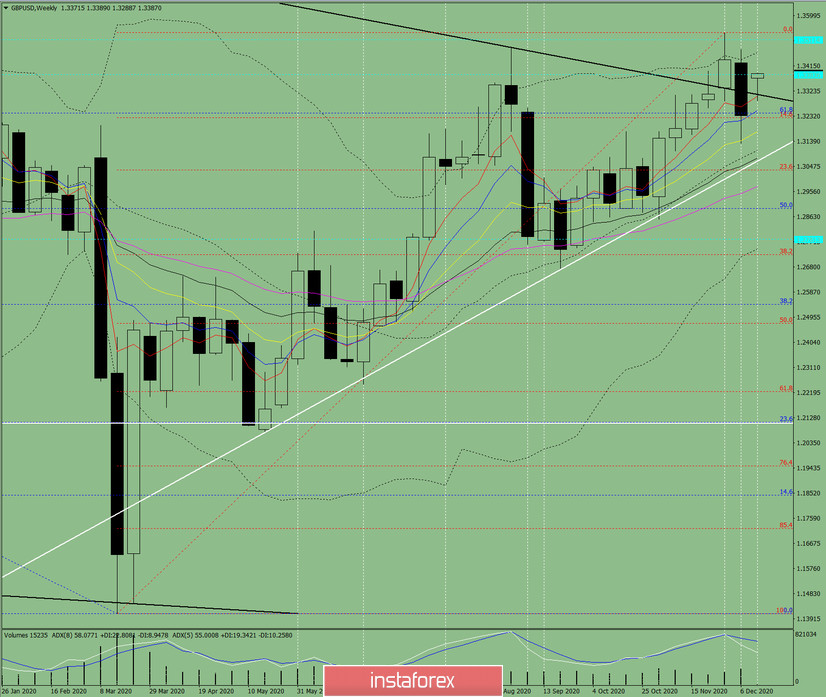
Figure 1 (weekly chart).
Comprehensive analysis:
- indicator analysis - up;
- Fibonacci levels - up;
- volumes - up;
- candlestick analysis - up;
- trend analysis - up
- Bollinger lines - up;
- monthly chart - up.
An upward movement can be concluded based on comprehensive analysis.
The overall result of the candlestick calculation on the weekly chart: the price is likely to have an upward trend this week, with the presence of the first lower shadow in the weekly white candlestick (Monday - down) and without the second upper shadow (Friday - down).
The first upward target is 1.3384 – the historical resistance level (blue dotted line). If this level is reached, it is possible to further rise to the target of 1.3538 – the upper fractal (red dashed line).
An alternative scenario: the price from the level of 1.3234 (closing of the last weekly candle) will move up to the first target of 1.3384 - the historical resistance level (blue dotted line). After reaching this level, it is possible to decline to the target of 1.3225 – the pullback level of 14.6% (red dotted line).
Dzięki analizom InstaForex zawsze będziesz na bieżące z trendami rynkowymi! Zarejestruj się w InstaForex i uzyskaj dostęp do jeszcze większej liczby bezpłatnych usług dla zyskownego handlu.


