 Anuluj
Warunki handlowe
Narzędzia


Here are the details of the economic calendar for October 8:
The report of the United States Department of Labor for September surprised the market in several key parameters. The report turned out to be even weaker than the August one, in terms of the number of newly created jobs – 194 thousand against the expected 500 thousand. However, the unemployment rate declined more than expected and reached the Fed's forecast value of 4.8% at the end of the year.
So, despite the decline in the unemployment rate, the US employment recovery slowed down in August-September. This is not the best signal. The US dollar slowed down its strengthening, losing ground locally.
Analysis of trading charts from October 8:
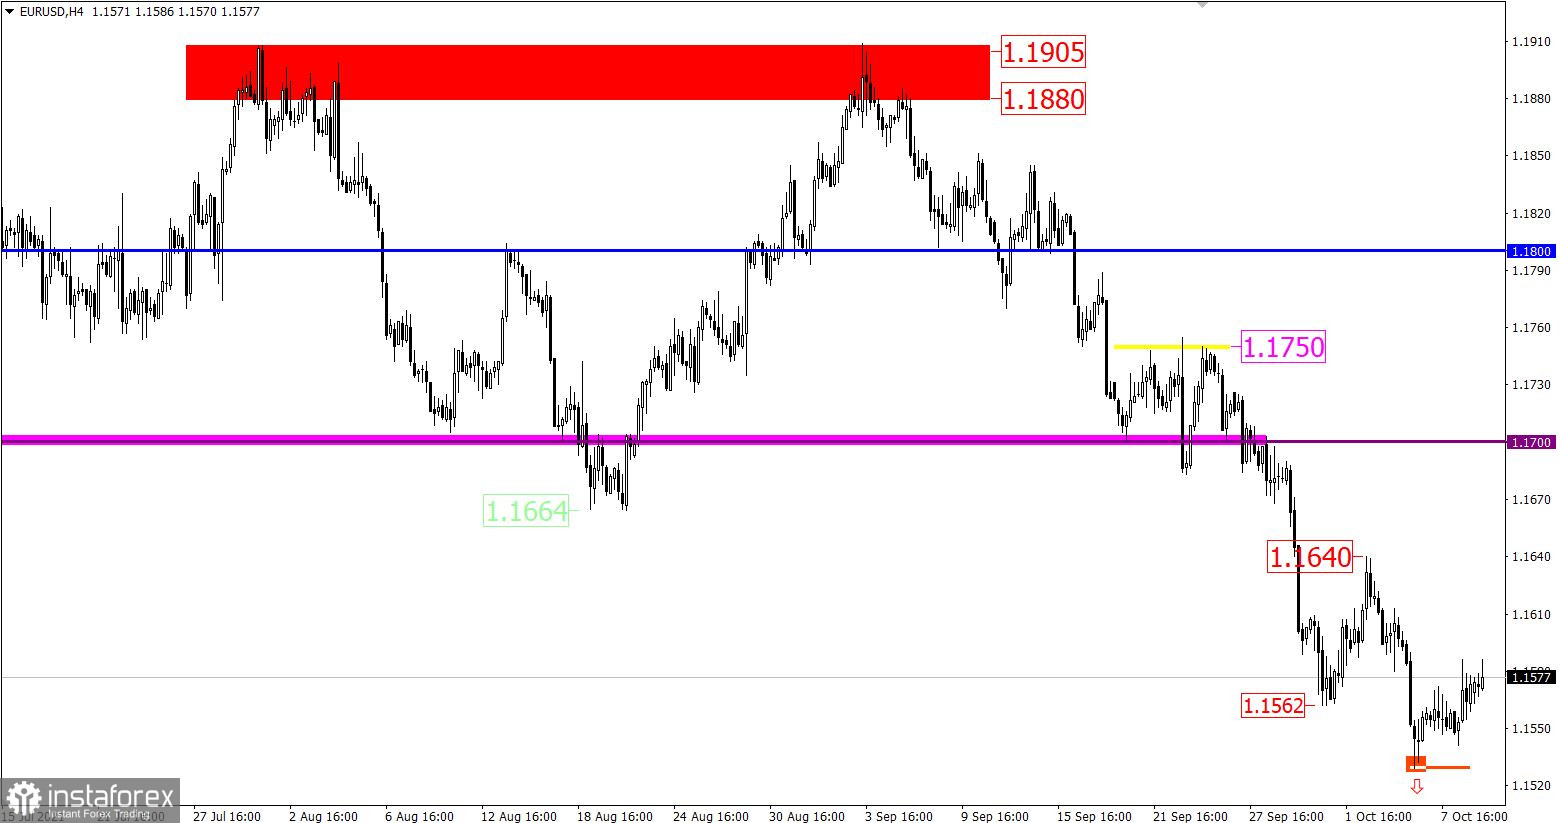
The EUR/USD pair slowed down the downward movement in the area of 1.1529, where a pullback occurred at the beginning, followed by a correction. The variable resistance level is 1.1586, relative to which there is stagnation.
Despite the correction stage, the market is still dominated by downward interest. This is indicated by a stable downward trend from the beginning of June.
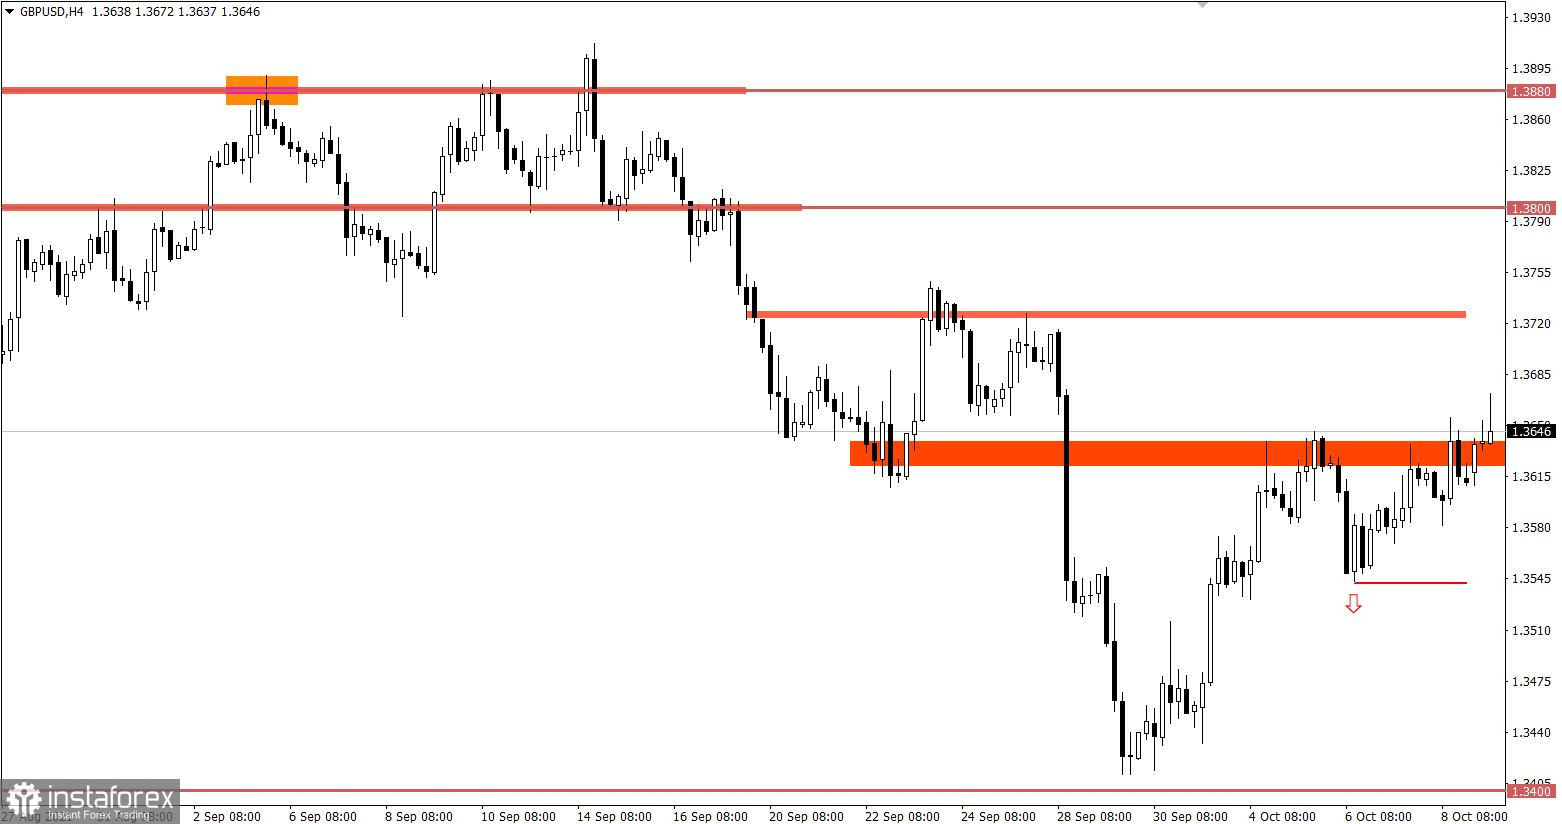
The GBP/USD pair still follows in the structure of the correction course, where the price area of 1.3620/1.3650 serves as resistance. An attempt to prolong the correction was repeatedly noticed on the market, but the quote failed to stay above the signal levels.

October 11 economic calendar:
Monday is traditionally accompanied by a completely blank macroeconomic calendar. Therefore, traders will adhere to Friday's data on the US Department of Labor report and technical analysis.
Trading plan for EUR/USD on October 11:
To continue the correction in the market, the quote must hold above the level of 1.1600. This will likely pave the way towards the local high of October 4.
The downward trend is still considered the main movement in the market, so keeping the price below the level of 1.1530 will prolong the cycle towards 1.1420.
Trading plan for GBP/USD on October 11:
It can be assumed that holding the price above the value of 1.3680 in a four-hour period will lead to a prolongation of the corrective course. In turn, this will open the way towards the level of 1.3750.
An alternative scenario considers the price rebound from the resistance area 1.3620/1.3650. This will lead to the end of the correction.
What is reflected in the trading charts?
A candlestick chart view is graphical rectangles of white and black light, with sticks on top and bottom. When analyzing each candle in detail, you will see its characteristics of a relative period: the opening price, closing price, and maximum and minimum prices.
Horizontal levels are price coordinates, relative to which a stop or a price reversal may occur. These levels are called support and resistance in the market.
Circles and rectangles are highlighted examples where the price of the story unfolded. This color selection indicates horizontal lines that may put pressure on the quote in the future.
The up/down arrows are the reference points of the possible price direction in the future.
Dzięki analizom InstaForex zawsze będziesz na bieżące z trendami rynkowymi! Zarejestruj się w InstaForex i uzyskaj dostęp do jeszcze większej liczby bezpłatnych usług dla zyskownego handlu.


