 Anuluj
Warunki handlowe
Narzędzia


EUR/USD
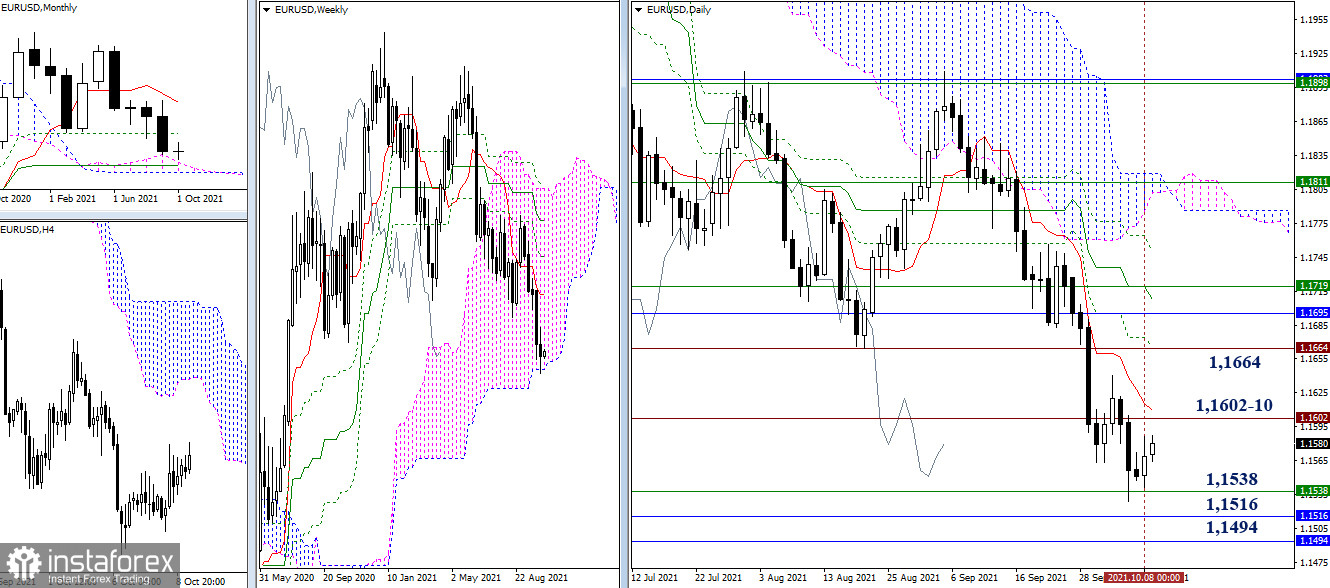
The bears failed to be convincing during the previous week's closing. The week was closed, maintaining a slowdown at the lower border of the monthly cloud (1.1538). With the development of the upward correction, we can consider the nearest resistance levels on the daily timeframe located at 1.1602-10 (daily short-term trend + historical level). After that, the resistance level at 1.1664 (historical level + daily Fibo Kijun) will come to the fore. If the corrective slowdown ends, the bearish activity will return and the level of 1.1538 will break down. The euro will then meet with monthly supports of 1.1516 (upper border of the cloud) and 1.1494 (medium-term trend).
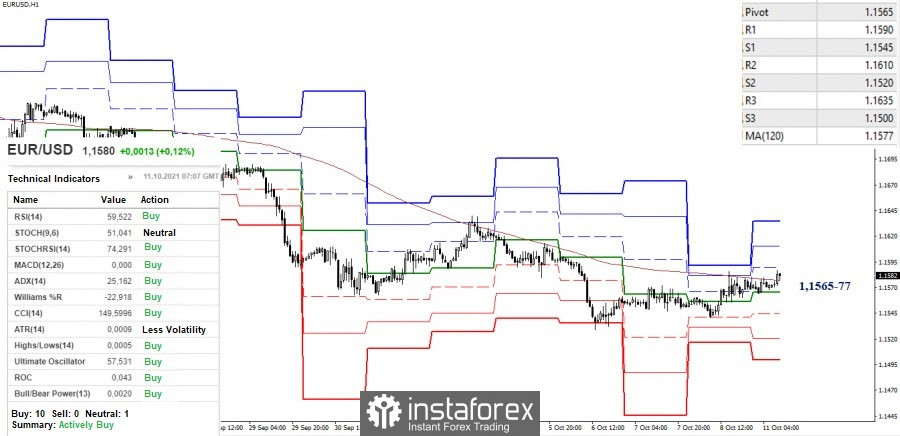
The key levels, which are joining forces in the area of 1.1565-77 (central pivot level + weekly long-term trend), are in the process of being taken. A consolidation above will change the balance of forces acting on the hourly chart. The next upward pivot points will be the resistances of the classic pivot levels (1.1590 - 1.1610 - 1.1635). These borders are strengthened by the resistances (1.1602-10) of the higher timeframes, so the result of consolidation above may have a longer-term perspective.
On the contrary, the formation of a rebound and a return below the key levels (1.1565-77) will be able to bring the bears back to the market. The downward pivot points are set at 1.1545 - 1.1520 - 1.1500 (classic pivot levels). They are also strengthened by support levels (1.1538 - 1.1516 - 1.1494) on the higher periods, which will largely determine the situation.
GBP/USD
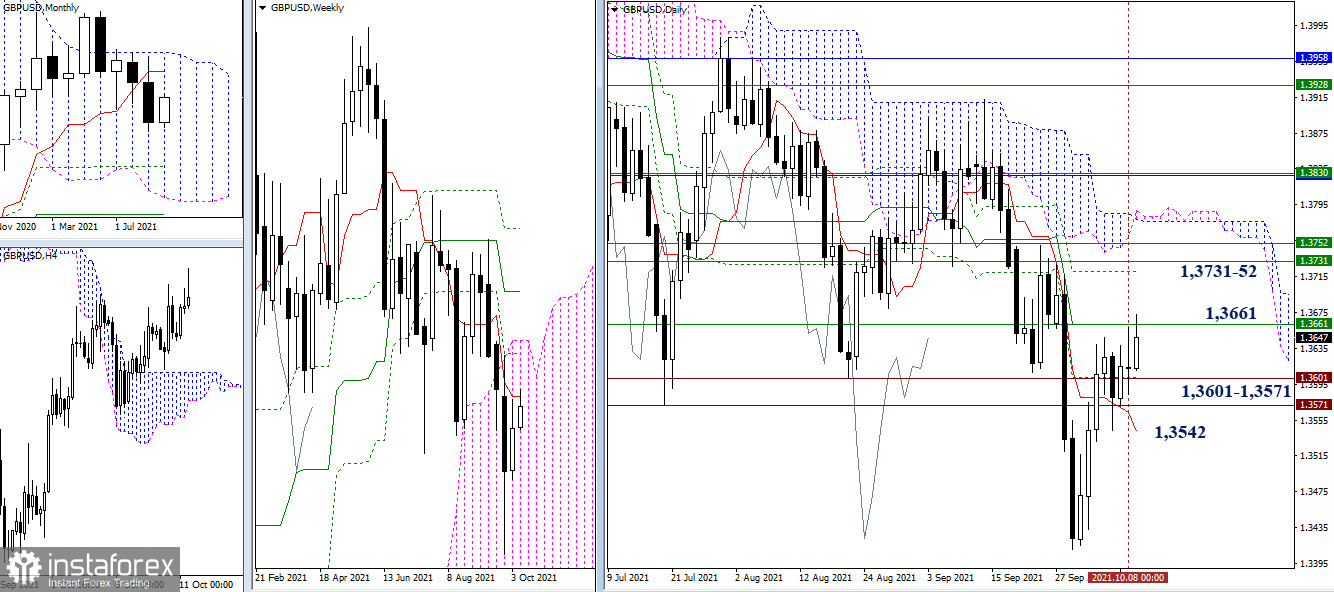
Despite the predominance of consolidation last week, some advantages remained on the bullish side. As a result, they continue to test the resistance level of 1.3661 (weekly short-term trend + daily medium-term trend). The breakdown of this level will open the way to a fairly wide resistance zone, whose closest important borders are 1.3731-52 (the upper border of the weekly cloud + weekly Fibo Kijun). If the consolidation persists, the historical and daily levels of 1.3601 - 1.3571 - 1.3542 will continue to provide attraction and support.
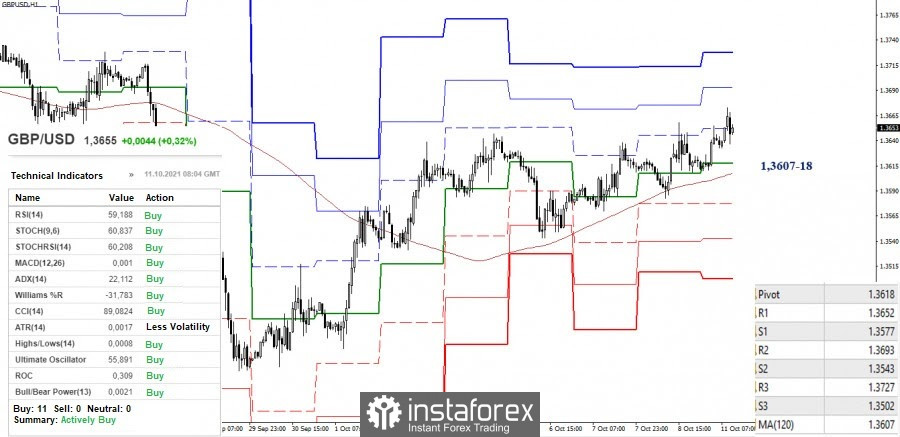
The current advantage in the smaller timeframes belongs to the bulls. They are testing the strength of the first resistance level of 1.3652 (R1). It is worth noting that the next intraday pivot points to rise are the resistances of 1.3693 (R2) and 1.3727 (R3) of the classic pivot level. The key levels in the same timeframe are forming support and are set in the area of 1.3607-18 (central pivot level + weekly long-term trend). Their breakdown and consolidation below will change the current balance of power in favor of the bears. The support levels, which will be relevant if the bearish mood strengthens, can be considered at 1.3577 - 1.3543 - 1.3502 (classic pivot levels).
***
Ichimoku Kinko Hyo (9.26.52) and Kijun-sen levels in the higher time frames, as well as classic Pivot Points and Moving Average (120) on the H1 chart, are used in the technical analysis of the trading instruments.
Dzięki analizom InstaForex zawsze będziesz na bieżące z trendami rynkowymi! Zarejestruj się w InstaForex i uzyskaj dostęp do jeszcze większej liczby bezpłatnych usług dla zyskownego handlu.

