 Anuluj
Warunki handlowe
Narzędzia


Here are the details of the economic calendar for October 11:
Monday was traditionally accompanied by an absolutely empty macroeconomic calendar. Traders mostly did not show activity, as a result of which the quote conditionally stood in one place.
Analysis of trading charts from October 11:
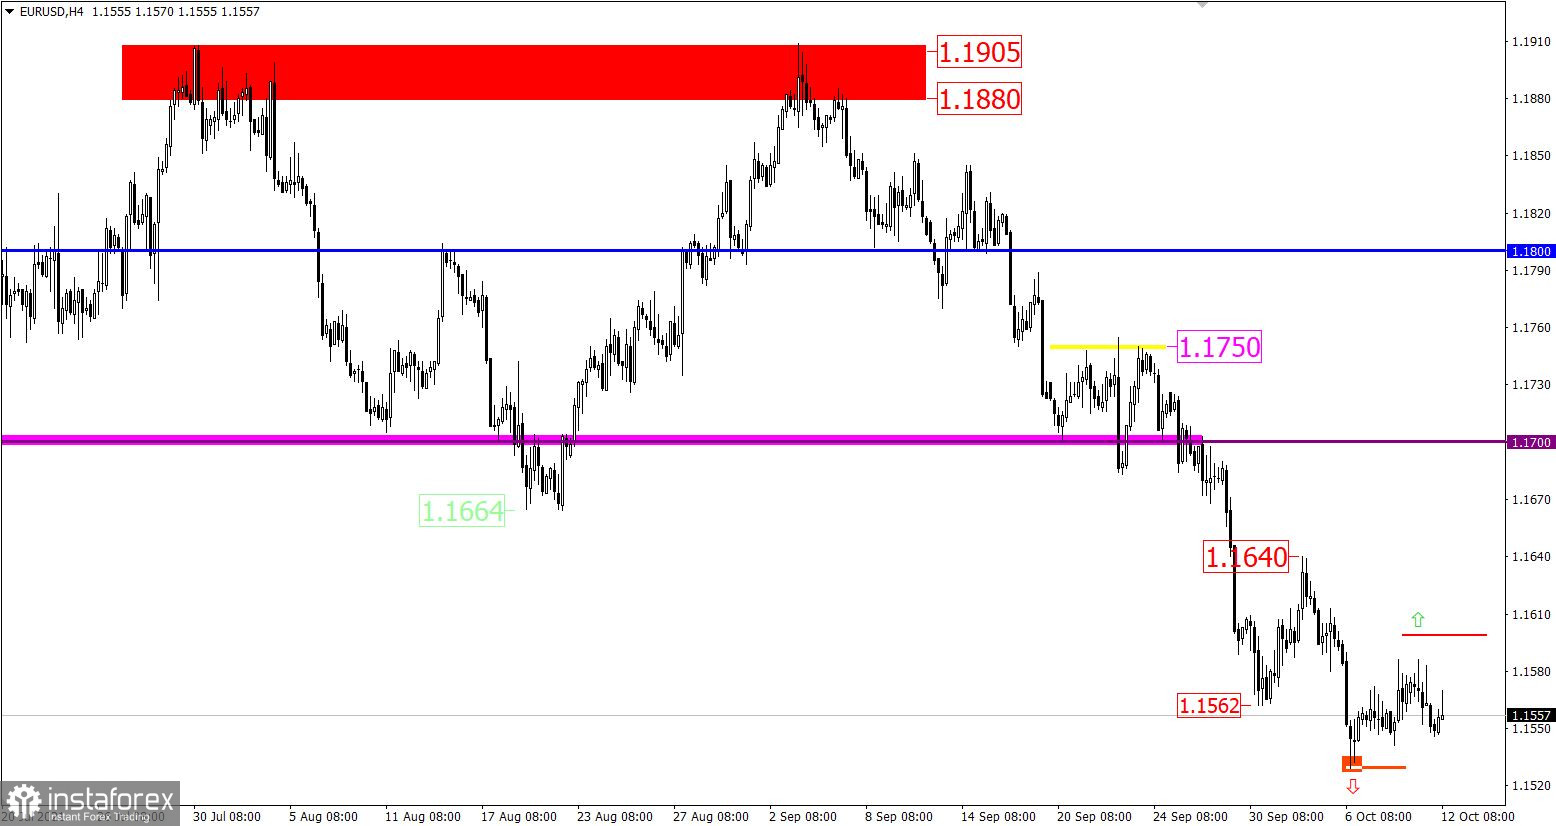
The EUR/USD pair slowed down the correctional movement in the area of 1.1586, where there was a reduction in the volume of long positions and a rebound in prices. In this situation, the main role is played by the downward trend cycle from the beginning of June, which most traders are focused on.
Therefore, the corrective move is only part of the structure of the downward trend, where the level of 1.1529 serves as a variable point.
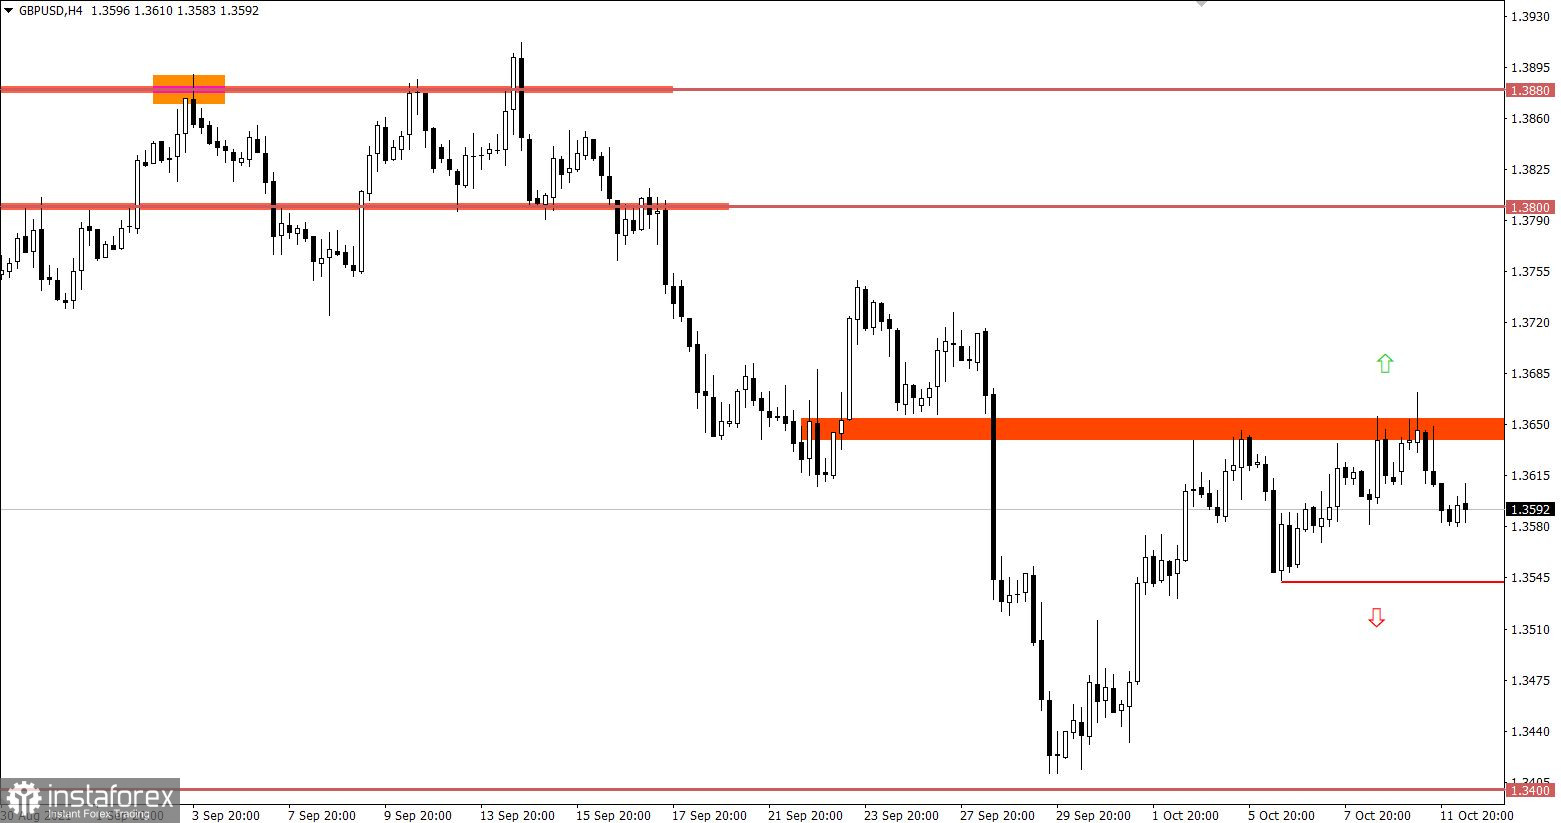
The GBP/USD pair is considering the area of 1.3620/1.3650 as resistance for the second week in a row, where the volume of long positions is systematically reduced. This leads to a slowdown in the correction and a reverse course.

October 12 economic calendar:
This morning, the UK already released its labor market data, where the indicators were not bad at all. Although the unemployment rate coincided with the forecast, it is still decreasing from 4.6% to 4.5%. At the same time, employment in the country increased by 235 thousand against 183 thousand in the previous reporting period.
The pound sterling literally ignored the statistics as if they never existed.
During the US trading session, America's data on open vacancies will be published. The number of which may decrease by 134 thousand, but will have little effect since there is nothing surprising in the reduction in the number of open vacancies after the decline in the unemployment rate.
Trading plan for EUR/USD on October 12:
In order for the downward cycle to be prolonged to new levels, the quote needs to stay below the level of 1.1530. This will open the way towards the level of 1.1420.
If we consider the scenario of a large-scale correction, then the quote needs to stay first above the 1.1600 mark. This will probably open the way to a local high on October 4.
Trading plan for GBP/USD on October 12:
It can be assumed that the movement in the area of the resistance level will remain in the market for some time. This will lead to the accumulation of trading forces, where a side channel will appear in the range of 1.3540/1.3670.
If expectations coincide, the most suitable trading tactic is a breakdown of one or another border of the established range.
Sell positions should be considered after holding the price above the level of 1.3680.
Sell positions should be considered after holding the price below the level of 1.3640.
* The accumulation process is price fluctuations in a closed amplitude, where a local acceleration towards the breakdown of a particular stagnation border often occurs.
What is reflected in the trading charts?
A candlestick chart view is graphical rectangles of white and black light, with sticks on top and bottom. When analyzing each candle in detail, you will see its characteristics of a relative period: the opening price, closing price, and maximum and minimum prices.
Horizontal levels are price coordinates, relative to which a stop or a price reversal may occur. These levels are called support and resistance in the market.
Circles and rectangles are highlighted examples where the price of the story unfolded. This color selection indicates horizontal lines that may put pressure on the quote in the future.
The up/down arrows are the reference points of the possible price direction in the future.
Dzięki analizom InstaForex zawsze będziesz na bieżące z trendami rynkowymi! Zarejestruj się w InstaForex i uzyskaj dostęp do jeszcze większej liczby bezpłatnych usług dla zyskownego handlu.

