 Anuluj
Warunki handlowe
Narzędzia


Bitcoin starts the trading week with a rebound from the support line of $60.2k, after which the impulse growth is close to the historical maximum. However, as a result, the cryptocurrency cannot continue to grow due to the local correction that inevitably comes after such a powerful impulse growth.
Thanks to such a clear rebound, there is no doubt about the imminent start of a bullish rally and the establishment of a new maximum. With this in mind, it is necessary to conduct a technical analysis of BTC horizontal charts in order to determine the likely start of a new period of bitcoin growth.
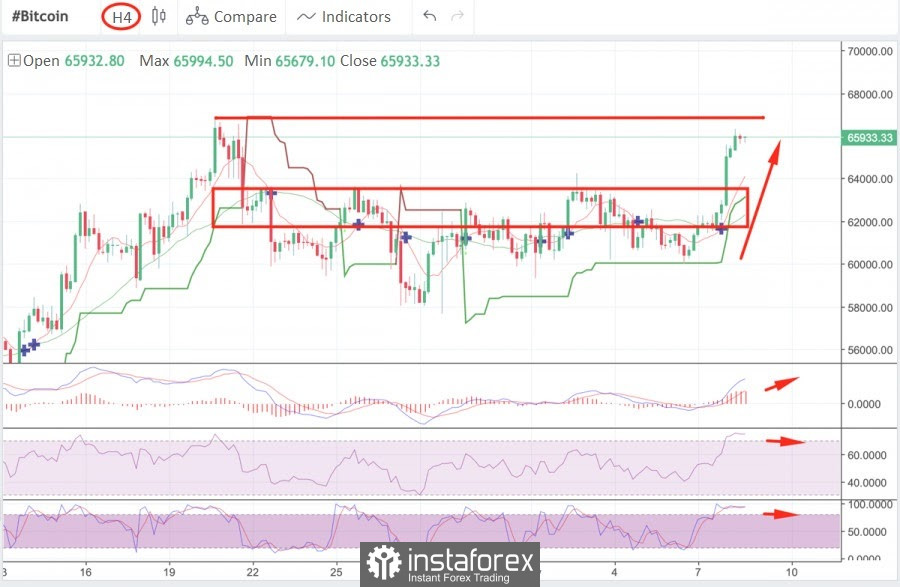
The four-hour chart clearly shows that there was an impulse price increase, which is typical for a rebound from the support zone. Despite this, the asset was close to breaking through this area and continuing to decline. In this case, the nearest key support zones would be $56.3k and $53.2k. However, movement to these levels is canceled due to a confident consolidation above $64k.
The coin came close to the resistance line of the historical maximum and began to decline. This was expected, as the quotes reached the zone after the sellers began to defend their positions, as can be seen from the upper wick of the largest bullish candle that appeared.
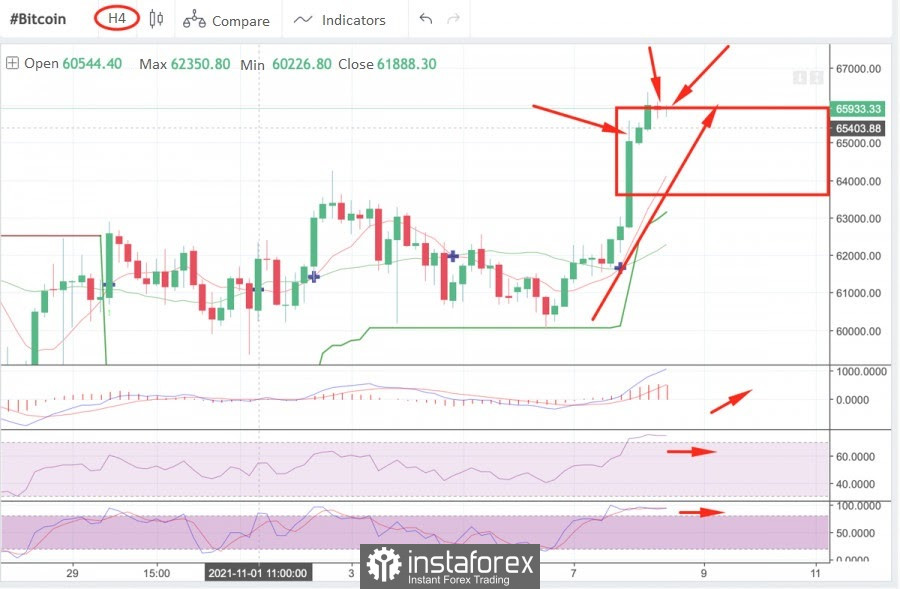
Despite this, bitcoin confidently broke through the weekly resistance zone and reached the $66k mark, near which it is trying to gain a foothold. An uncertain bearish Doji candle has formed on the four-hour chart, indicating the weakness of sellers in these positions.
However, the subsequent bullish candle also looks extremely uncertain, which may mean the start of a consolidation period with a parallel decline within the $63.4k-$65.9k channel. This is also evidenced by the unspoken rule that any impulse movement ends with a local correction period to stabilize the situation.
In addition, technical indicators also indicate the beginning of a stabilization period: the MACD still maintains an upward movement, but the level of buyers has fallen significantly. This is signaled by the start of the sideways movement of the stochastic oscillator and the relative strength index. It is worth noting that both indicators are outside the safe zone (above 60), which is also a signal to overbought bitcoin and the need for correction.
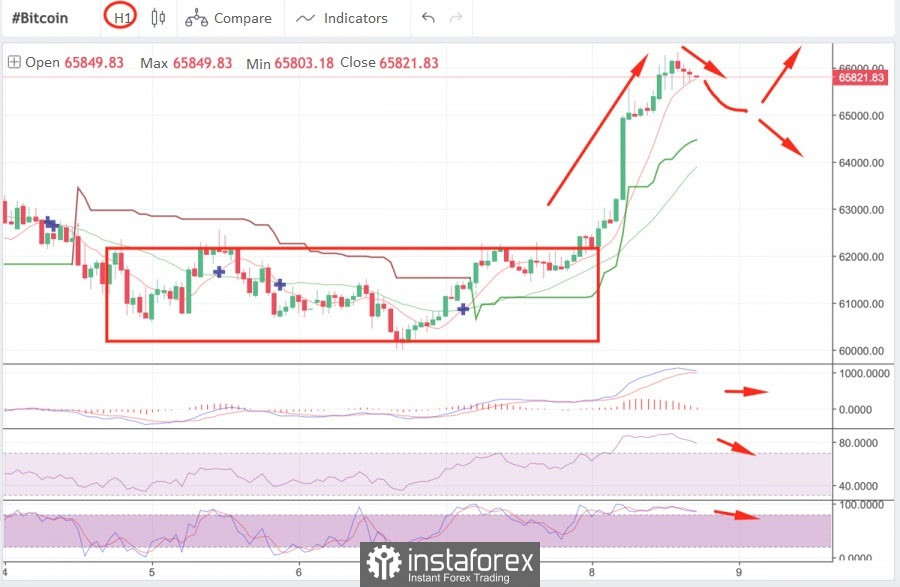
A clear pattern has formed on the hourly chart for a further price decrease. After the bears seized the initiative (three red candles in a row), a candle formation consisting of three uncertain Doji candles appeared. This pattern is a clear sign of a price decline. It is most likely that the fall will continue to $65k, where the local support zone passes, and where the price can make an upward rebound. However, the option with a decrease to $65k and further price stabilization looks more plausible.
At the same time, there is a possibility of continuing upward movement and a reversal of the local trend. Technical indicators of the cryptocurrency indicate a systematic decline in the price, which indicates a healthy correction after an impulse growth. The MACD is preparing to form a bullish intersection, and the stochastic and the relative strength index are turning in a downward direction. The $65.8-$65.7k range is an excellent area to enter a downside with a stop loss around $65k.
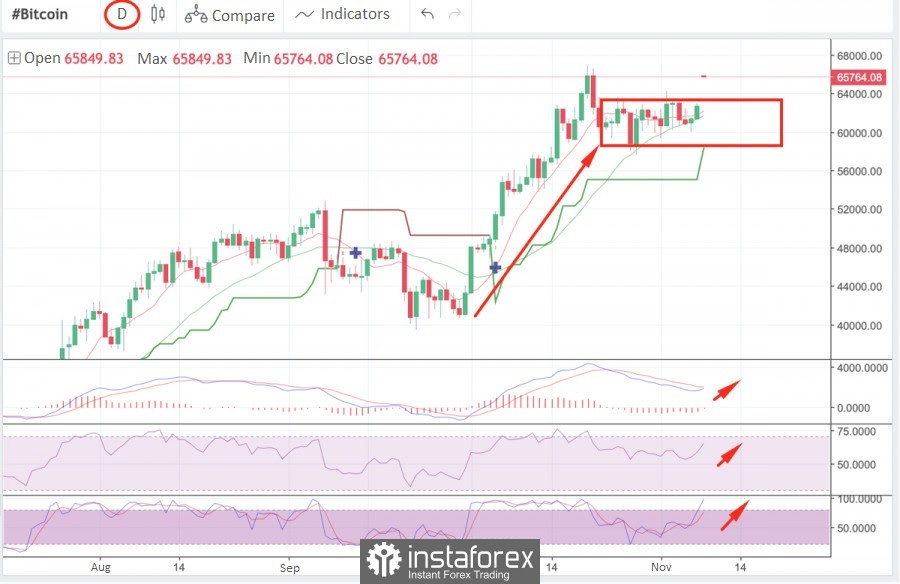
On the daily chart, bitcoin has made an important breakthrough beyond the usual fluctuation corridor, which is a strong bullish signal. If the price is firmly fixed above $64.4k, then we can talk about the continuation of the bullish rally to new heights.
Technical indicators are steadily moving up: the MACD is preparing to form a bullish intersection, and the stochastic and the RSI index are moving in a bullish zone, which indicates the activation of buyers.
The global bullish trend is beyond doubt, as is the establishment of new price highs this week. Most likely, Bitcoin will be able to reach the $73k mark and continue its upward movement with local pauses on correction.
Dzięki analizom InstaForex zawsze będziesz na bieżące z trendami rynkowymi! Zarejestruj się w InstaForex i uzyskaj dostęp do jeszcze większej liczby bezpłatnych usług dla zyskownego handlu.

