 Anuluj
Warunki handlowe
Narzędzia


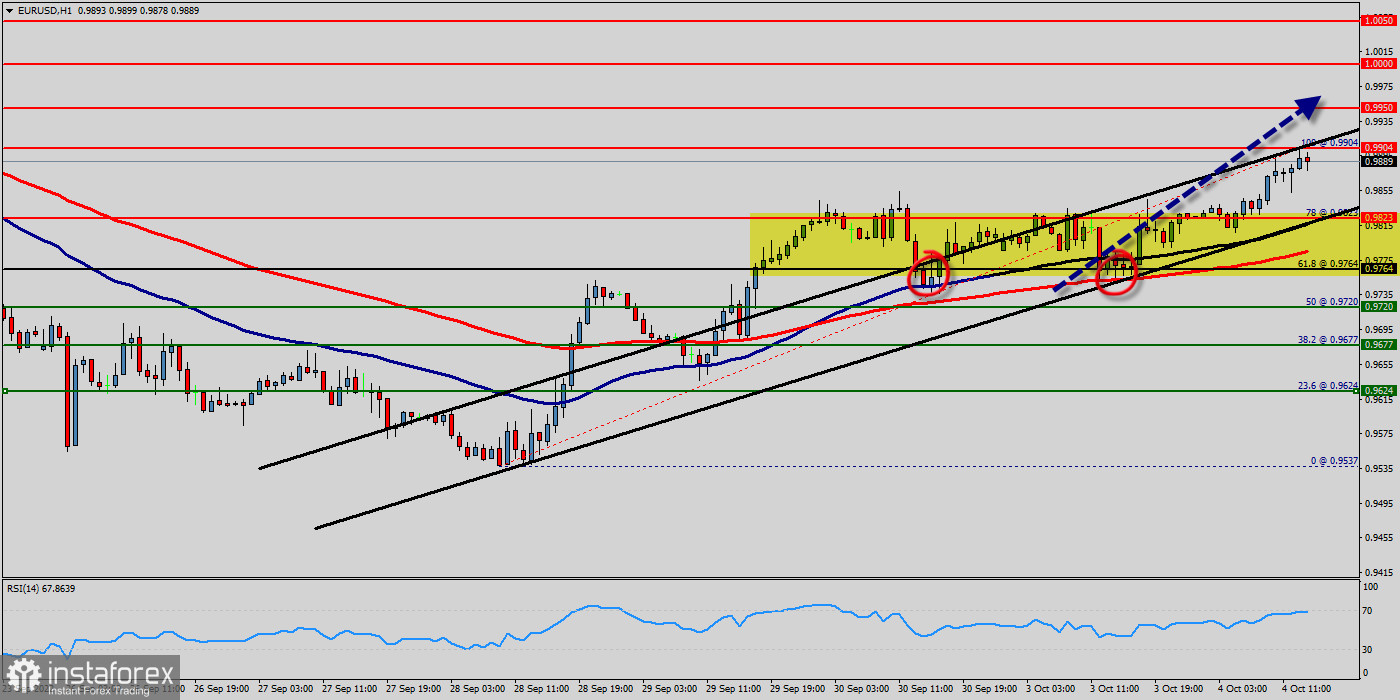
The bullish trend is currently very strong for the EUR/USD pair. As long as the price remains above the support levels of 0.9764 and 0.9823, you could try to take advantage of the bullish rally.
Over the past week, the price of the EUR/USD pair has been plummeting with strong bullish momentum, resulting in a break above the 50-day and 100-day moving averages lines on the daily timeframe, indicating that the bulls are presently in control of the market.
The euro's strong gains against the US dollar have continued this week ahead of the NFP. The common currency reached a high of more than two years earlier this morning GMT at 0.9900. Signs of progress toward new fiscal stimulus in the USA and the dollar's general weakness have been key factors despite weak economic data affecting both currencies. This technical analysis of the EUR/USD pair looks at the one-hour chart.
The resistance of the EUR/USD pair has broken; it turned to support around the price of 0.9823 last week. Thereby, forming a strong support at 0.9764. The direction of the EUR/USD pair into the close this week is likely to be determined by trader reaction to 0.9823 and 0.9950.
The EUR/USD pair climbed above the level of 0.9823 before it started a downside correction. The EUR/USD pair set above strong support at the level of 0.9764, which coincides with the 61.8% Fibonacci retracement level. This support has been rejected for three times confirming uptrend veracity. Hence, major support is seen at the level of 0.9764 because the trend is still showing strength above it.
The level of 0.9764 coincides with the golden ratio (61.8% of Fibonacci retracement) which is acting as major support today. Another thought; the Relative Strength Index (RSI) is considered overbought because it is above 60. At the same time, the RSI is still signaling an upward trend, as the trend is still showing strong above the moving average (100), this suggests the pair will probably go up in coming hours.
The first bullish objective is located at 0.9904. The bullish momentum would be revived by a break in this resistance (0.9904). Buyers would then use the next resistance located at 0.9950 as an objective.
Crossing it would then enable buyers to target 0.9950. Be careful, given the powerful bullish rally underway, excesses could lead to a short-term rebound.
If this is the case, remember that trading against the trend may be riskier. It would seem more appropriate to wait for a signal indicating reversal of the trend.
Accordingly, the market will probably show the signs of a bullish trend. This suggests the pair will probably go up in coming hours. Accordingly, the market is likely to show signs of a bullish trend
In other words, rebuy orders are recommended above 0.9950 level with their third target at the level of 1 USD.
From this point, the pair is likely to begin an ascending movement to the point of 0.9904 and further to the level of 0.9950. The price of 1 USD will act as a strong resistance and retest the psychological price again.
On the other hand, if a break happens at the support of 0.9764, then this scenario may become invalidated. This content is for information purposes only and in no way constitutes investment advice or any incentive whatsoever to buy or sell financial instruments. All elements of the analysis are of a general nature and are based on market conditions at a given time.
Dzięki analizom InstaForex zawsze będziesz na bieżące z trendami rynkowymi! Zarejestruj się w InstaForex i uzyskaj dostęp do jeszcze większej liczby bezpłatnych usług dla zyskownego handlu.

