 Anuluj
Warunki handlowe
Narzędzia


Trend analysis
The price from the level of 1.1384 (closing of the December monthly candlestick) will decline to the target of 1.1205 – the historical support level (blue dotted line) this month. After reaching this level, it may move up to the target of 1.1460 – the pullback level of 23.6% (blue dotted line). After this level is reached, the upward movement may resume to the target of 1.1628 – the pullback level of 38.2% (blue dotted line).
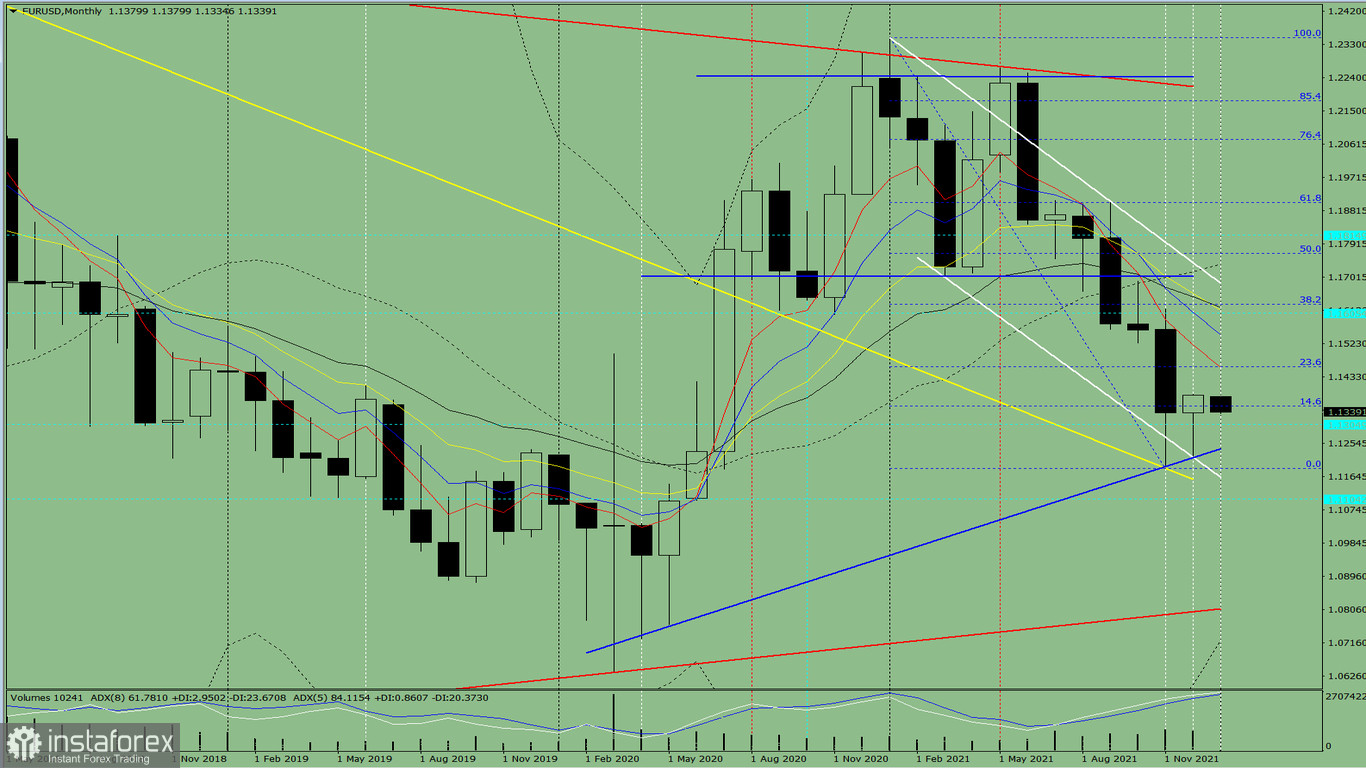
Fig 1 (monthly chart)
Indicator analysis:
An upward movement can be concluded based on a comprehensive analysis.
The overall result of the candlestick calculation based on the monthly chart: the price will most likely move in an upward trend, with the first lower shadow (the first week of the month is the lower one) and without the second upper shadow (the past week is white) in the monthly white candlestick.
General scenario: the price from the level of 1.1384 (closing of the December monthly candlestick) is likely to fall this month to the target of 1.1205 – the historical support level (blue dotted line), and then it can rise to the target of 1.1460 – the pullback level of 23.6% (blue dotted line). After reaching this level, growth may continue to the target of 1.1628 – the pullback level of 38.2% (blue dotted line).
Alternatively, the price may decline from the level of 1.1384 (closing of the December monthly candlestick) to the target of 1.1239 – support line (blue bold line). If this line is tested, it may rise to the target of 1.1356 – the pullback level of 14.6% (blue dotted line) and move higher.
Dzięki analizom InstaForex zawsze będziesz na bieżące z trendami rynkowymi! Zarejestruj się w InstaForex i uzyskaj dostęp do jeszcze większej liczby bezpłatnych usług dla zyskownego handlu.


