 Anuluj
Warunki handlowe
Narzędzia


Trend analysis
The market, which opened with a gap down to 1.1125 on Monday, may attempt to test the historical resistance level of 1.1305 (blue dotted line). Then, it will move to the historical resistance level of 1.1387 (blue dotted line), before moving up to the upper fractal at 1.1494 (weekly candle from 02/06/2022).
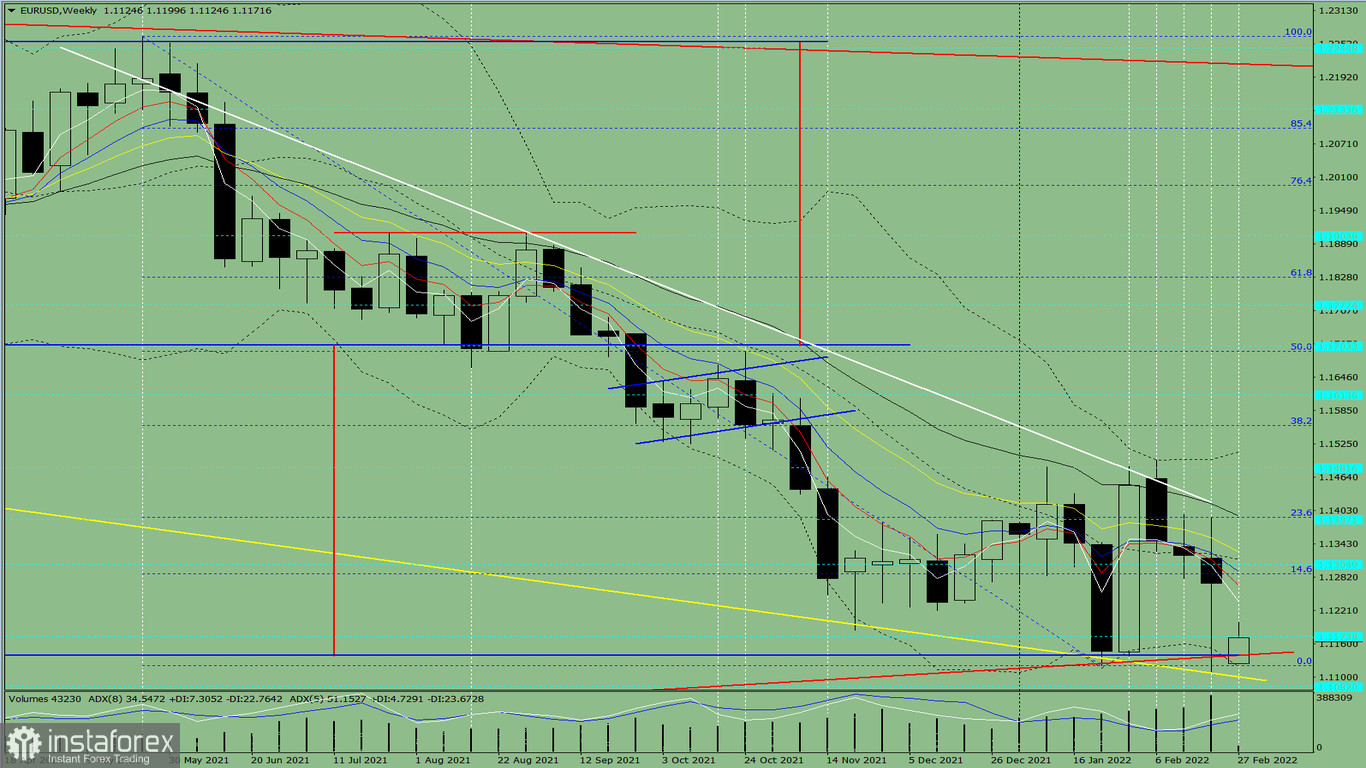
Fig. 1 (daily chart)
Comprehensive analysis:
Indicator analysis - uptrend
Fibonacci levels - uptrend
Volumes - uptrend
Candlestick analysis - uptrend
Trend analysis - uptrend
Bollinger bands - uptrend
Monthly chart - uptrend
All this points to an upward movement in EUR/USD.
Conclusion: The pair will have an upward trend with no lower shadow on the weekly white candle (Monday - up) and no second upper shadow (Friday - up).
During the week, the pair will climb from 1.1125 to the historical resistance level of 1.1305 (blue dotted line), then move to the historical resistance level of 1.1387 (dashed blue line). Following that will be a rise to 1.1494, which is the upper fractal (weekly candle from 02/06/2022).
Alternatively, the pair could rally from 1.1125 to historical resistance level of 1.1174 (blue dotted line), then go down to 1.1101, which is the support line (thick yellow line). If this line is tested, the price may bounce back to 1.1288, which is the 14.6% retracement level (dashed blue line).
Dzięki analizom InstaForex zawsze będziesz na bieżące z trendami rynkowymi! Zarejestruj się w InstaForex i uzyskaj dostęp do jeszcze większej liczby bezpłatnych usług dla zyskownego handlu.


