 Anuluj
Warunki handlowe
Narzędzia


Details of the economic calendar for August 5
The United States Department of Labor report for July came out remarkably well. The unemployment rate fell from 3.6% to 3.5%, despite forecasts to remain at the same level. Outside of agriculture, 528,000 new jobs were created, almost 1.5 times more than the forecast. Recall that a month earlier, the report for June showed an increase in employment by 398,000. That is, the current figures are very strong.
As a result, based on the published statistical data, the US dollar sharply strengthened relative to its competitors in the market.
Analysis of trading charts from August 5
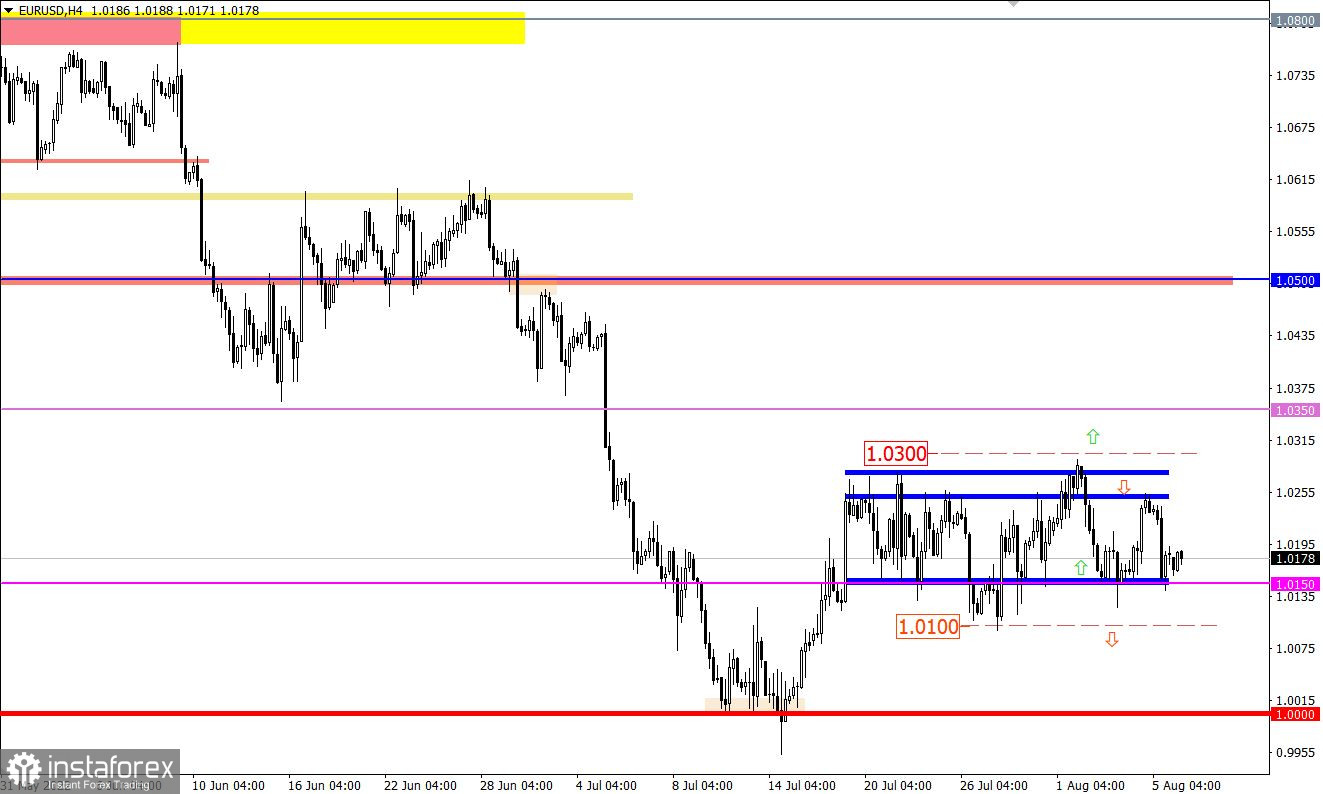
The EURUSD currency pair, despite everything, is moving within the 1.0150/1.0270 side channel, consistently fulfilling the set boundaries. Last Friday, the quotes rebounded from the upper border and rushed to the lower area, where the volume of short positions decreased. A consistent cycle of fluctuations is essential in the market, which enables traders to work from the regular basis of the past.
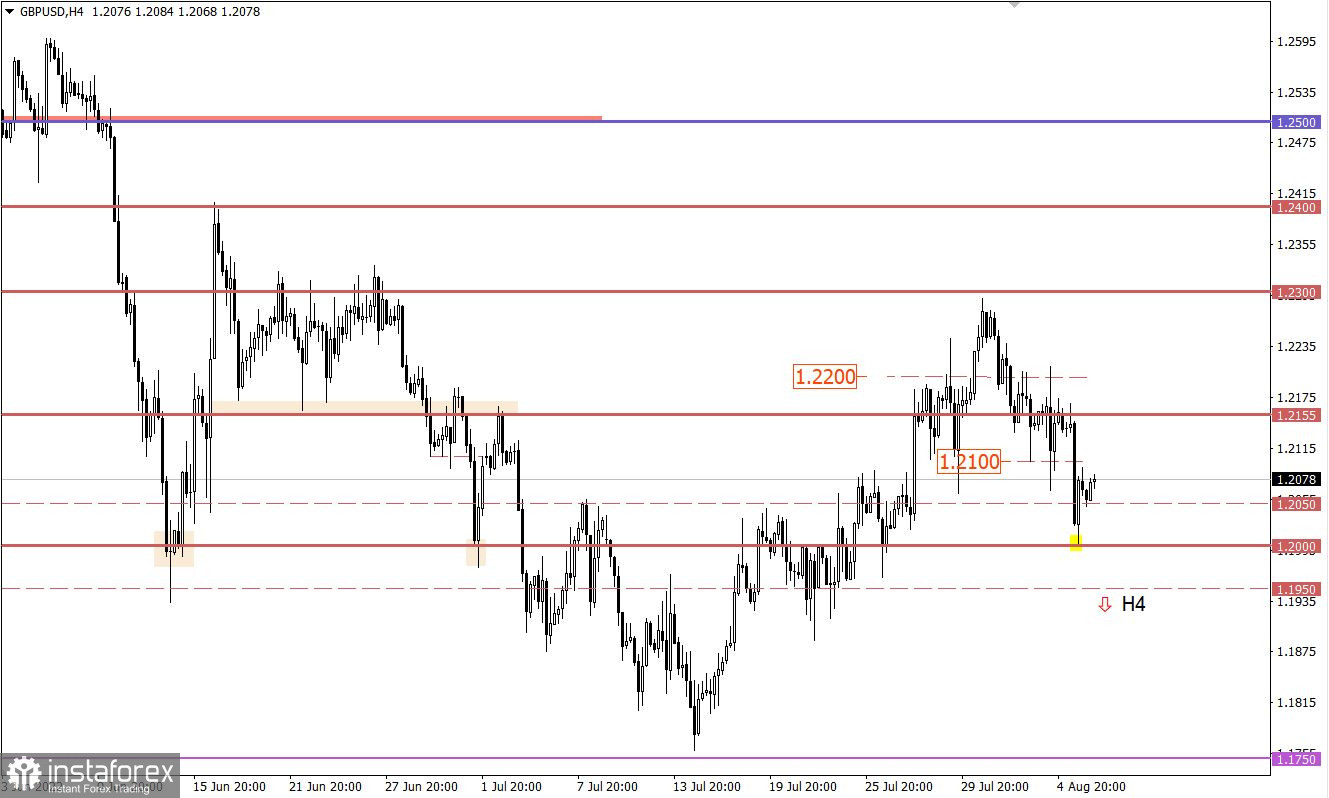
The GBPUSD currency pair has reached the psychological level of 1.2000 during an intensive downward move. As a result of this price jump, a local oversold status of the pound sterling appeared in the short-term periods, where the reduction in the volume of short positions began near the control level. As a result, the market experienced a technical pullback.

Economic calendar for August 8
Monday is traditionally accompanied by an empty macroeconomic calendar. Important statistics in Europe, the UK, and the United States are not expected.
Traders may continue working out Friday's data on the report. In this case, the US dollar will continue to strengthen.
Trading plan for EUR/USD on August 8
The flat stage is still relevant in the market, as indicated by the current price rebound from the lower border. In this situation, subsequent increase in the volume of long positions is expected after the price holds above the value of 1.0200. In this scenario, it is possible to consider movement toward 1.2150/1.2170.
The main strategy, as before, is considered to be the method of breaking one of the control levels: 1.0300 – when considering the upward development of the market; 1.0100 – if market participants are focused on going towards the parity level.
Note that the signal must be confirmed in a four-hour period.
Trading plan for GBP/USD on August 8
In this situation, the level of 1.2000 still puts pressure on sellers. For this reason, the pullback stage remains in the market. The subsequent increase in the volume of short positions will occur after the price holds below the value of 1.1950.
What is shown in the trading charts?
A candlestick chart view is graphical rectangles of white and black light, with sticks on top and bottom. When analyzing each candle in detail, you will see its characteristics of a relative period: the opening price, closing price, and maximum and minimum prices.
Horizontal levels are price coordinates, relative to which a stop or a price reversal may occur. These levels are called support and resistance in the market.
Circles and rectangles are highlighted examples where the price of the story unfolded. This color selection indicates horizontal lines that may put pressure on the quote in the future.
The up/down arrows are the reference points of the possible price direction in the future.
Dzięki analizom InstaForex zawsze będziesz na bieżące z trendami rynkowymi! Zarejestruj się w InstaForex i uzyskaj dostęp do jeszcze większej liczby bezpłatnych usług dla zyskownego handlu.

