 Anuluj
Warunki handlowe
Narzędzia


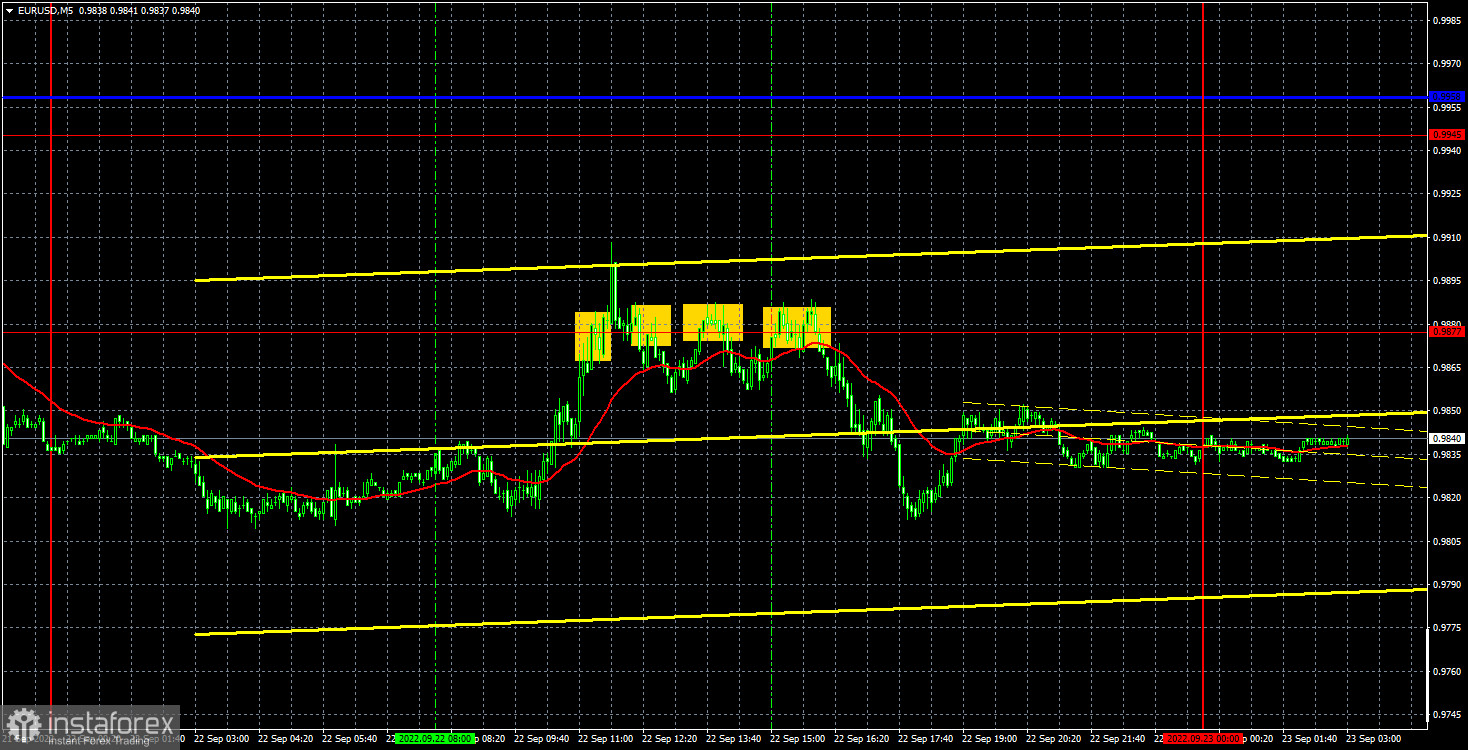
The EUR/USD pair first plunged to the new 20-year low at 0.9813, therefore it adjusted slightly, and then returned to the level of 0.9813 for a reason or no reason at all. This time the pair did not overcome the level, but it should be understood that over the past day and a half, the euro has already fallen significantly. So we would say that everything is going according to plan. Recall that we have repeatedly stated that the current downward trend does not look complete, and the foundation and geopolitics do not provide a reason to expect the euro's growth. Moreover, there are no technical signals for growth. And the US central bank meeting, its results and Federal Reserve Chairman Jerome Powell's speech... the market for once worked them out absolutely logically. Monetary policy in the US will continue to tighten, so the dollar's growth is quite logical.
Thursday's trading signals were not all right, but you should remember that the pair has not been at the current price values for more than 20 years, so there are simply practically no levels to trade. All the signals of the past day were formed around the level of 0.9877, which itself was recently formed. The first buy signal turned out to be false, but it could be ignored, since at the time of its formation, the price had already gone up 90 points. The next three sell signals could be worked out, but only with one short position, since the price went down more than 15 points only in the third case so that traders could set a Stop Loss to breakeven. However, it was not necessary, and the position should have bee
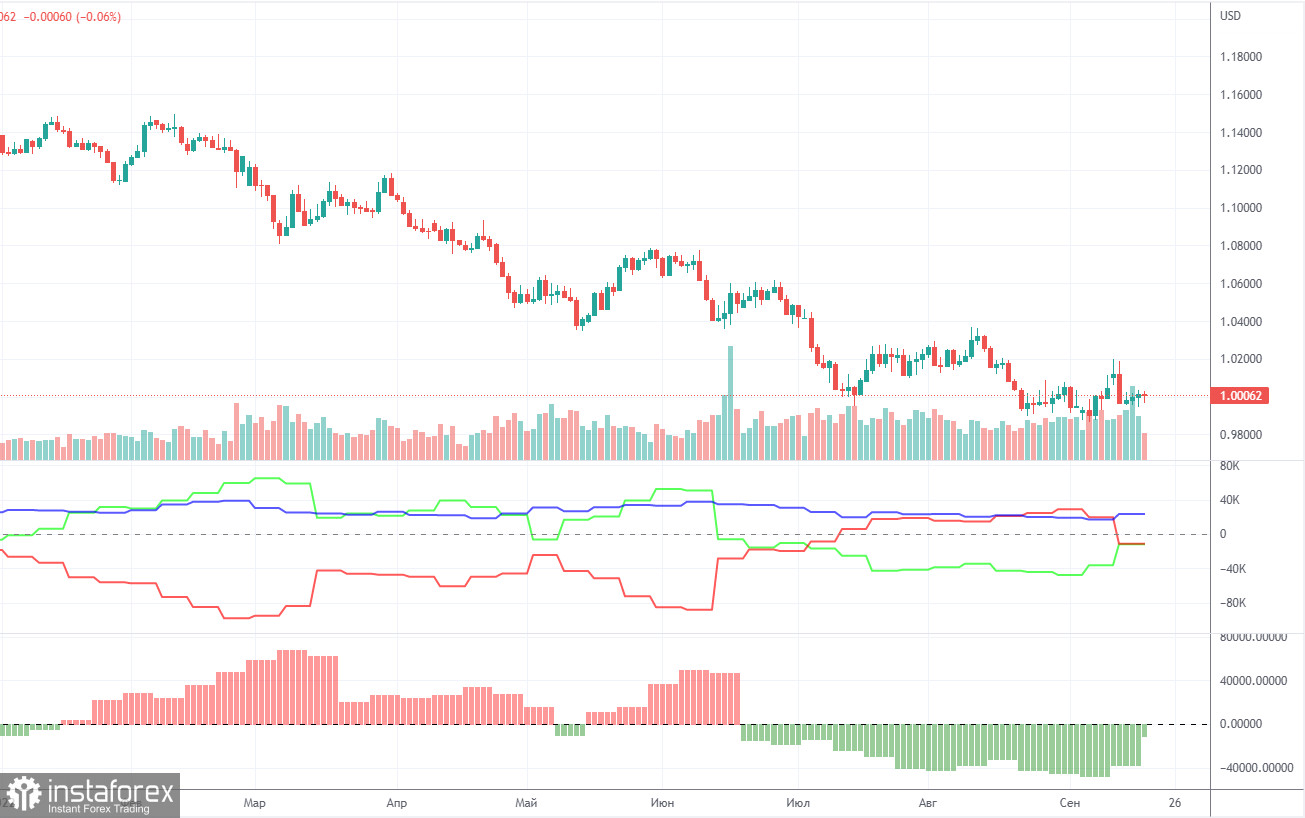
The Commitment of Traders (COT) reports on the euro in the last few months clearly reflect what is happening in the euro/dollar pair. For half of 2022, they showed a blatant bullish mood of commercial players, but at the same time, the euro fell steadily at the same time. At this time, the situation is different, but it is NOT in favor of the euro. If earlier the mood was bullish, and the euro was falling, now the mood is bearish and... the euro is also falling. Therefore, for the time being, we do not see any grounds for the euro's growth, because the vast majority of factors remain against it. During the reporting week, the number of long positions for the non-commercial group increased by 2,500, while the number of shorts decreased by 22,000. Accordingly, the net position grew by about 24,500 contracts. This is quite a lot and we can talk about a significant weakening of the bearish mood. However, so far this fact does not give any dividends to the euro, which still remains "at the bottom". The only thing is that in recent weeks it has done without another collapse, unlike the pound. At this time, commercial traders still do not believe in the euro. The number of longs is lower than the number of shorts for non-commercial traders by 12,000. This difference is no longer too large, so one could expect the start of a new upward trend, but what if the demand for the US dollar remains so high that even the growth in demand for the euro does not save the situation for the euro/dollar currency pair?
Overview of the EUR/USD pair. September 23. The euro is plunging again, but not hopelessly. The Fed raised the rate by 0.75% and promised to raise it by another 1.25%.
Overview of the GBP/USD pair. September 23. Even the Bank of England's rate hike did not help the British pound.
Forecast and trading signals for GBP/USD on September 23. Detailed analysis of the movement of the pair and trading transactions.
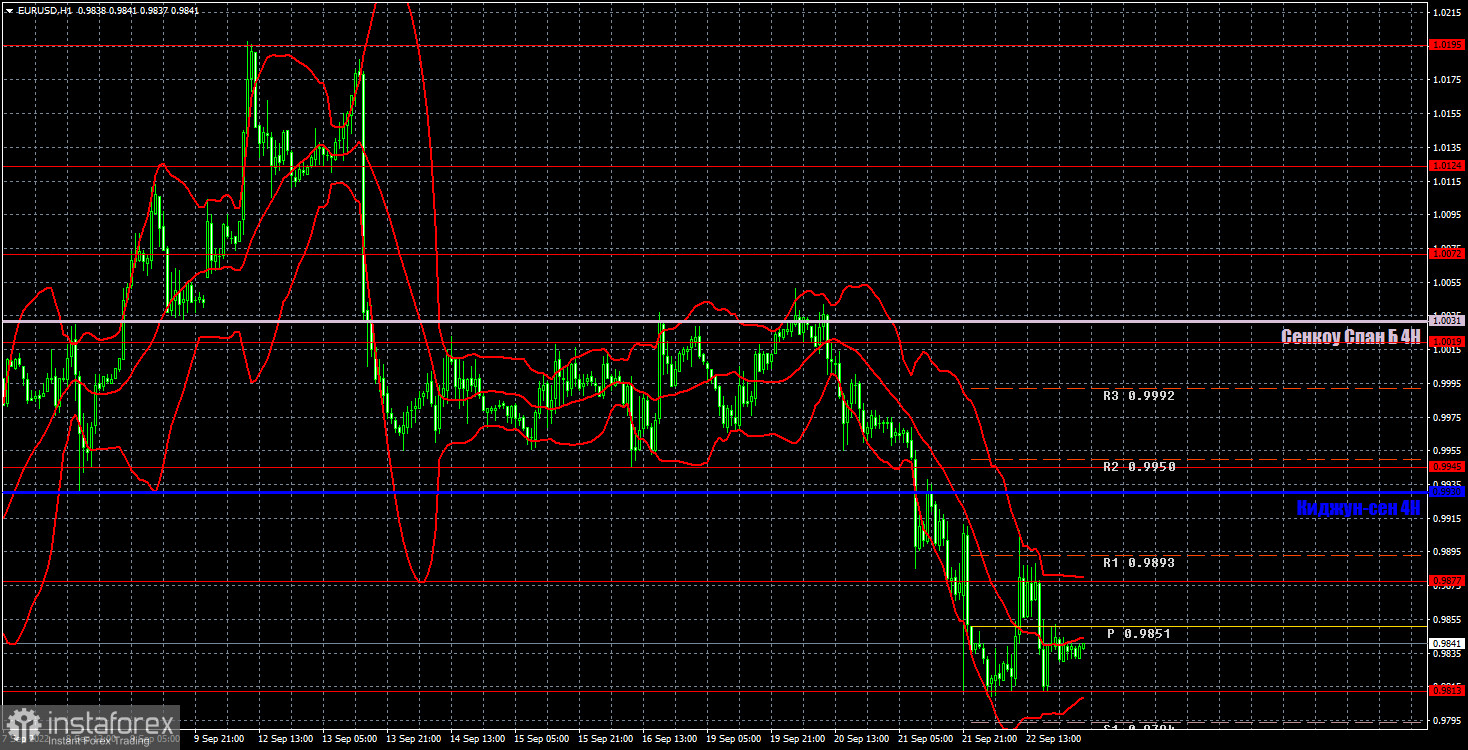
The bears' prospects remain very good on the hourly timeframe. Now it is already possible to sum up the results of the Fed meeting, and we see that the euro responded with a new fall, and the dollar – with growth. This trend, from our point of view, will continue in the future. Now the euro is (again) under pressure from geopolitics. We allocate the following levels for trading on Friday – 0.9813, 0.9877, 0.9945, 1.0019, 1.0072, 1.0124, 1.0195, 1.0269, as well as the Senkou Span B (1.0031) and Kijun-sen (0.9930) lines. The lines of the Ichimoku indicator can move during the day, which should be taken into account when determining trading signals. There are also secondary support and resistance levels, but no signals are formed near them. Signals can be "bounces" and "breakthrough" levels - extremes and lines. Do not forget about placing a Stop Loss order at breakeven if the price went in the right direction of 15 points. This will protect you against possible losses if the signal turns out to be false. Business activity indices in the service and manufacturing sectors will be published in the European Union and the United States on September 23. These data will clearly be in the shadow of the Fed meeting, but still a small reaction of the pair may follow them.
Support and Resistance Levels are the levels that serve as targets when buying or selling the pair. You can place Take Profit near these levels.
Kijun-sen and Senkou Span B lines are lines of the Ichimoku indicator transferred to the hourly timeframe from the 4-hour one.
Support and resistance areas are areas from which the price has repeatedly rebounded off.
Yellow lines are trend lines, trend channels and any other technical patterns.
Indicator 1 on the COT charts is the size of the net position of each category of traders.
Indicator 2 on the COT charts is the size of the net position for the non-commercial group.
Dzięki analizom InstaForex zawsze będziesz na bieżące z trendami rynkowymi! Zarejestruj się w InstaForex i uzyskaj dostęp do jeszcze większej liczby bezpłatnych usług dla zyskownego handlu.


