 Anuluj
Warunki handlowe
Narzędzia


Yesterday, the GBP/USD currency pair continued its sharp and powerful growth, which began on Friday. We still believe that the pair's movement is absolutely illogical, but the market thinks otherwise, and the pound continues to grow. At the moment, the price has overcome all lines of the Ichimoku indicator on the one-hour timeframe and settled above the Ichimoku cloud on the 24-hour timeframe. Therefore, both the pound and the euro finally have concrete technical grounds to count on a new upward trend. It is still unclear how strong and long it will be. We would only like to note that the fundamental and macroeconomic background remains unchanged, so it is difficult for us to count on a strong upward movement. However, both European currencies have been falling for a long time, it may be time for a correction globally. The US and British news calendar did not contain anything interesting on Monday, so the growth of the euro and the pound was not associated with any specific reasons.
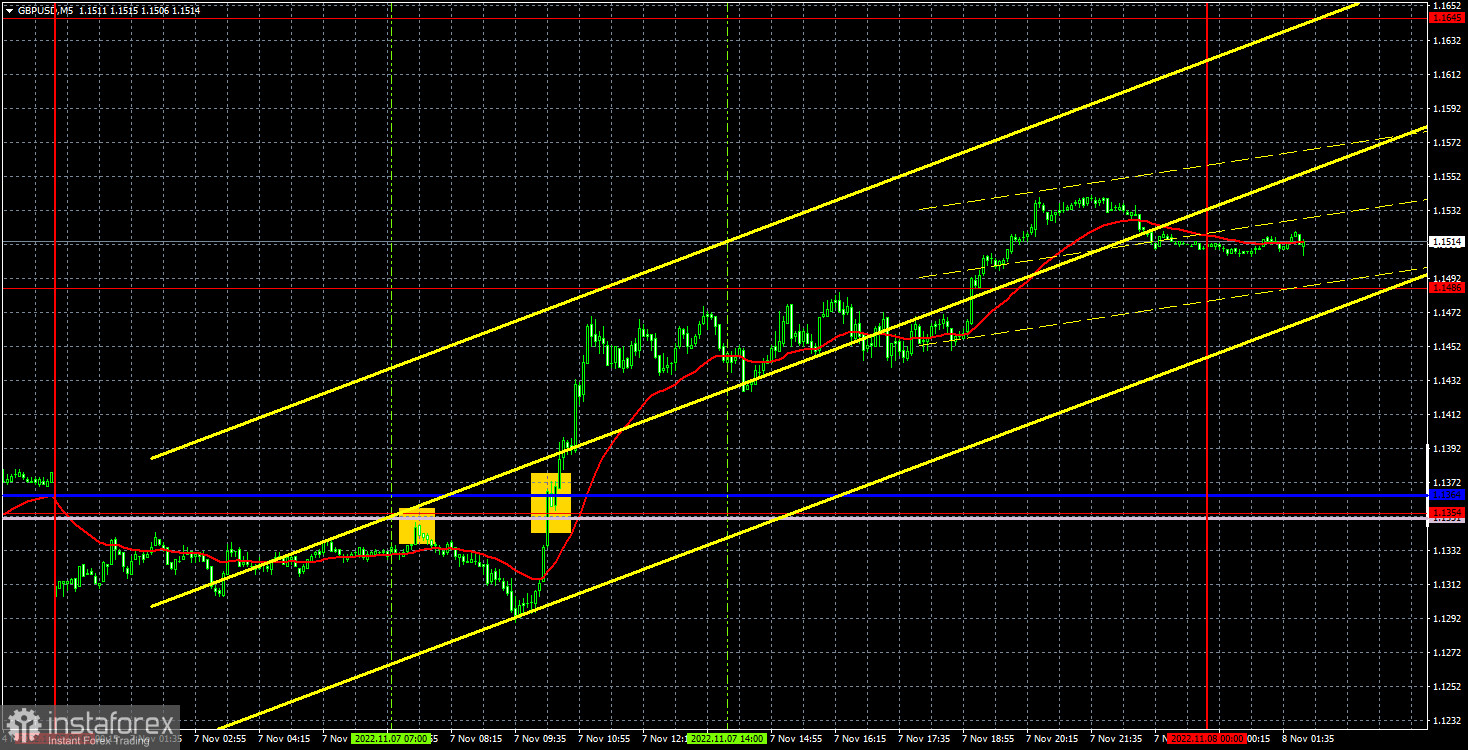
In regards to Monday's trading signals, everything was as simple as possible. The first sell signal near the Senkou Span B line turned out to be false, the price still went in the right direction for 45 points, so traders at least managed to set Stop Loss to breakeven, on which the short position was closed. This was followed by the price surpassing the 1.1351-1.1364 range, which was a signal to buy, which also had to be worked out. Subsequently, the pair went up to the level of 1.1486, near which the position should have been closed. Profit amounted to at least 100 points. Although the pair spent most of the day in a flat, after all, two upward jerks provided traders with a decent profit.
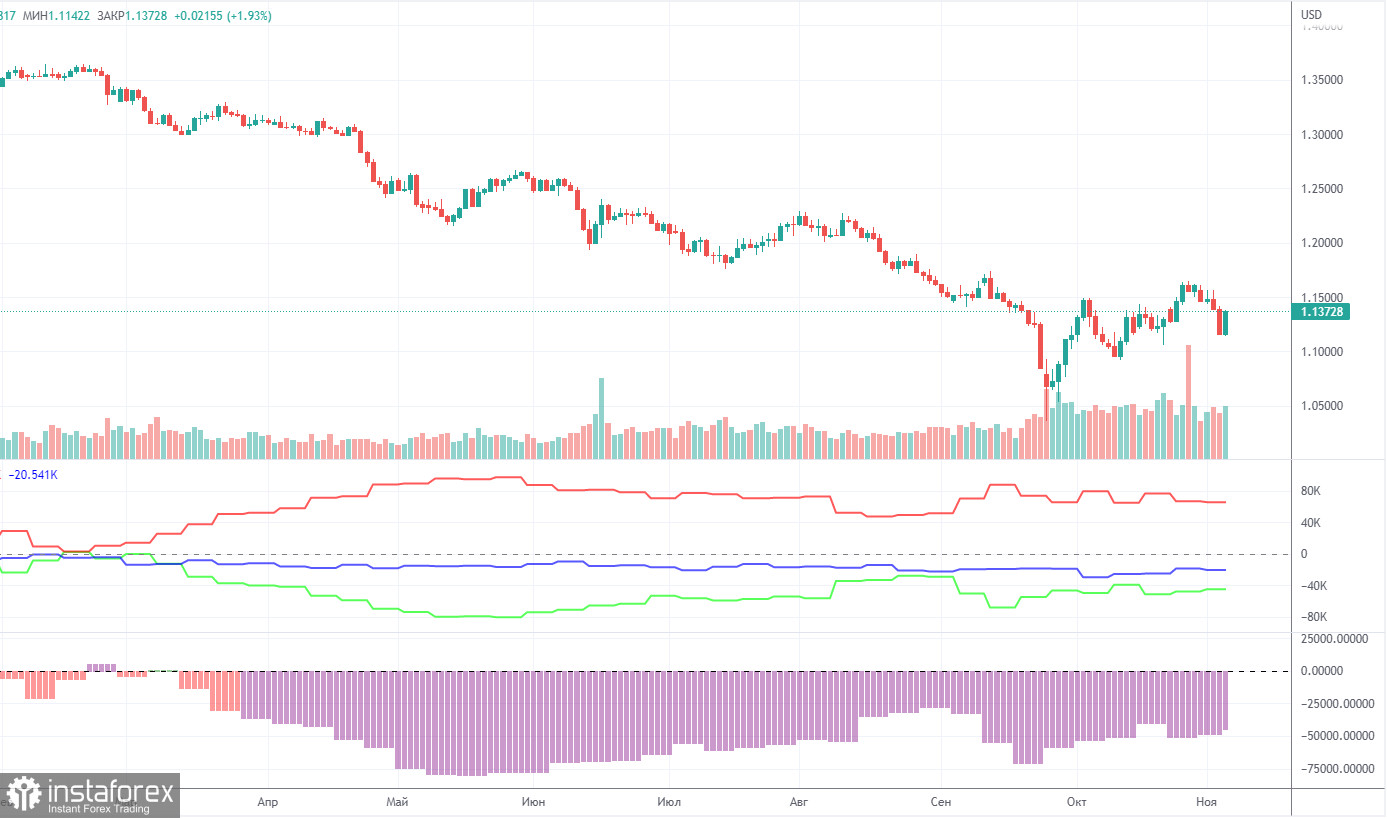
The latest Commitment of Traders (COT) report on the British pound showed a slight weakening of the bearish sentiment. In the given period, the non-commercial group closed 8,500 long positions and 11,500 short positions. Thus, the net position of non-commercial traders increased by 3,000, which is very small for the pound. The net position indicator has been slowly rising in recent weeks, but this is not the first time it has risen, but the mood of the big players remains "pronounced bearish" and the pound remains on a downward trend in the medium term. And, if we recall the situation with the euro, then there are big doubts that based on the COT reports, we can expect a strong growth from the pair. How can you count on it if the market buys the dollar more than the pound? The non-commercial group has now opened a total of 79,000 shorts and 34,000 longs. The difference, as we can see, is still very big. The euro cannot rise even though major players are bullish, and the pound will suddenly be able to grow in a bearish mood? As for the total number of open longs and shorts, here the bulls have an advantage of 21,000. But, as we can see, this indicator also does not help the pound too much. We remain skeptical about the long-term growth of the British currency, although there are certain technical reasons for this.
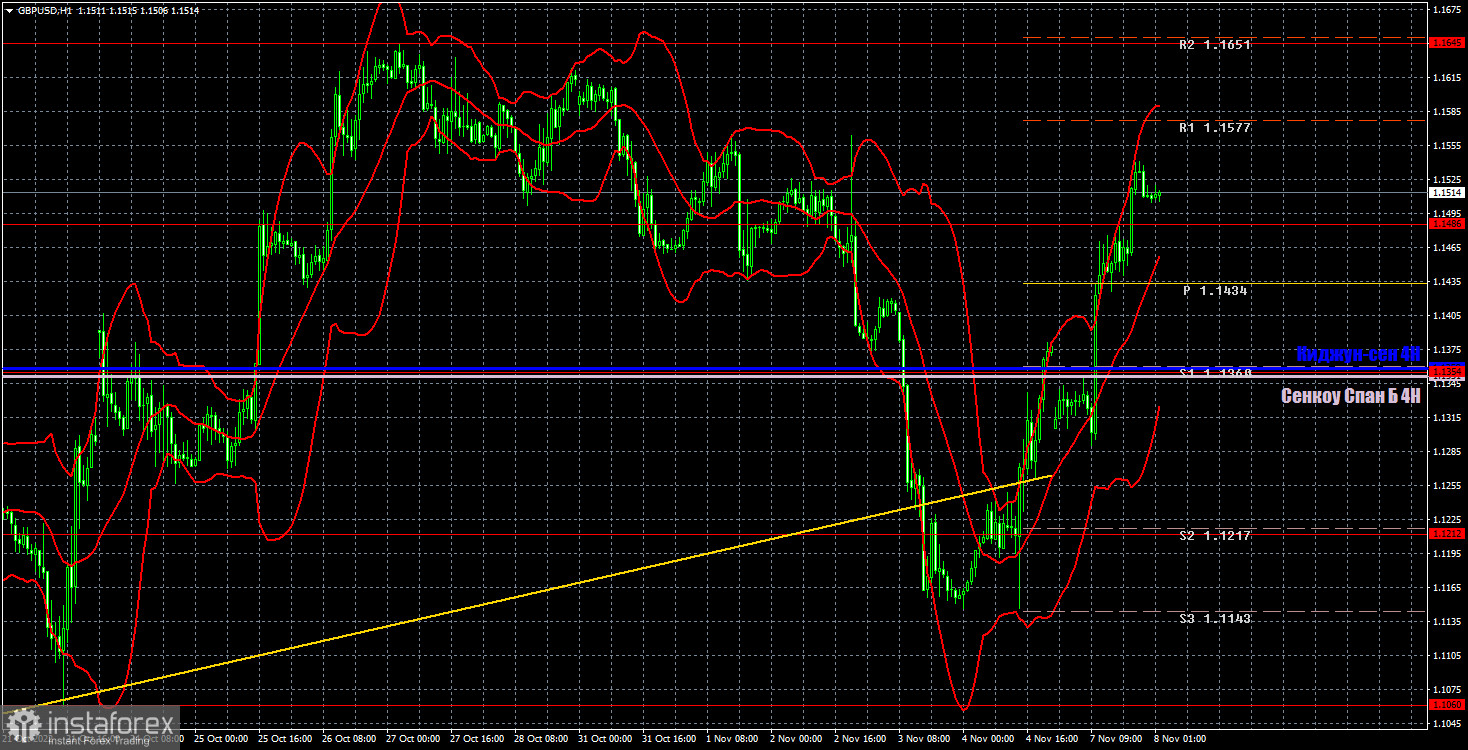
The pound/dollar pair shows such movements on the one-hour chart that it is very difficult to say which trend it is in at all. First, there was a sharp fall and then it settled below the key lines of the Ichimoku indicator, as well as the trend line. But now the pair has settled above the Kijun-sen and Senkou Span B lines. Grounds for growth that would last even longer have appeared on higher time frames, but the situation is still unsteady. On Tuesday, the pair may trade at the following levels: 1.1060, 1.1212, 1.1354, 1.1486, 1.1645, 1.1760. The Senkou Span B (1.1351) and Kijun-sen (1.1356) lines can also give signals if the price rebounds or breaks these levels. The Stop Loss level is recommended to be set to breakeven when the price passes in the right direction by 20 points. The lines of the Ichimoku indicator may move during the day, which should be taken into account when determining trading signals. Also, there are support and resistance levels that can be used to lock in profits. There are no major events scheduled in the UK and the US on Tuesday, but the market may continue to trade in a very volatile manner, continuing to work out the events and reports of the past week. Not all of them have been worked out logically, but market participants are not worried about this.
Price levels of support and resistance are thick red lines, near which the movement may end. They do not provide trading signals.
The Kijun-sen and Senkou Span B lines are the lines of the Ichimoku indicator, moved to the one-hour chart from the 4-hour one. They are strong lines.
Extreme levels are thin red lines from which the price bounced earlier. They provide trading signals.
Yellow lines are trend lines, trend channels, and any other technical patterns.
Indicator 1 on the COT charts reflects the net position size of each category of traders.
Indicator 2 on the COT charts reflects the net position size for the non-commercial group.
Dzięki analizom InstaForex zawsze będziesz na bieżące z trendami rynkowymi! Zarejestruj się w InstaForex i uzyskaj dostęp do jeszcze większej liczby bezpłatnych usług dla zyskownego handlu.


