 Anuluj
Warunki handlowe
Narzędzia


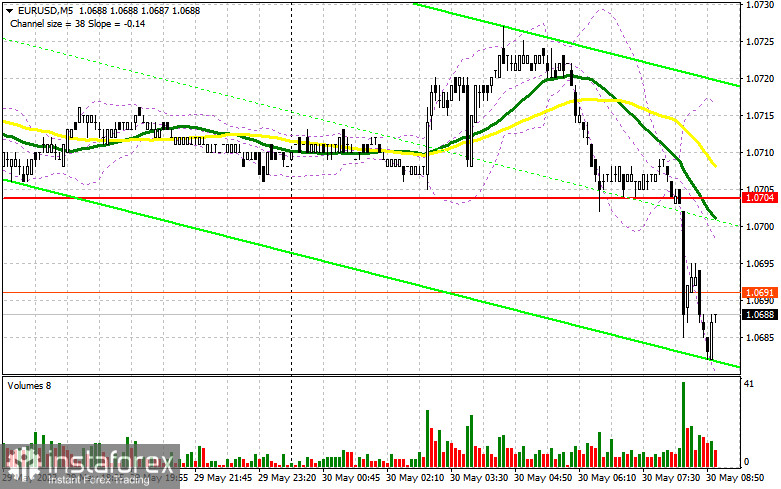
Yesterday, no trading signals came. Let's turn to the M5 chart to get a picture of what happened. Previously, I considered entering the market from 1.0704. However, the price did not reach the mark, and no signals were generated due to low volatility. In the second half of the day, volatility was even lower. No entry points were created.
When to open long positions on EUR/USD:
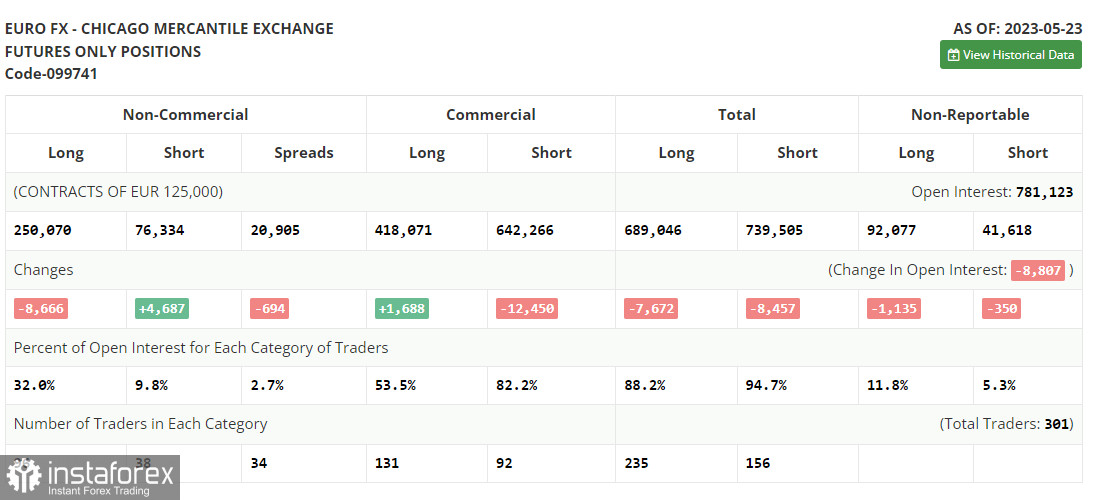
Let's see what has changed in the futures market. According to the COT report for May 23, long positions decreased and short positions grew. The euro extended the fall because the US debt ceiling was then a burning issue and recession risks were high. However, even when the debt limit deal was reached, demand for the greenback remained buoyant. The latest inflation data confirmed the need for more rate hikes from the Fed. The COT report showed that non-commercial long positions dropped by 8,666 to 250,070, and non-commercial short positions increased by 4,687 to 76,334. The overall non-commercial net position came in at 185,045 versus 187,089. The weekly closing price fell to 1.0793 from 1.0889.
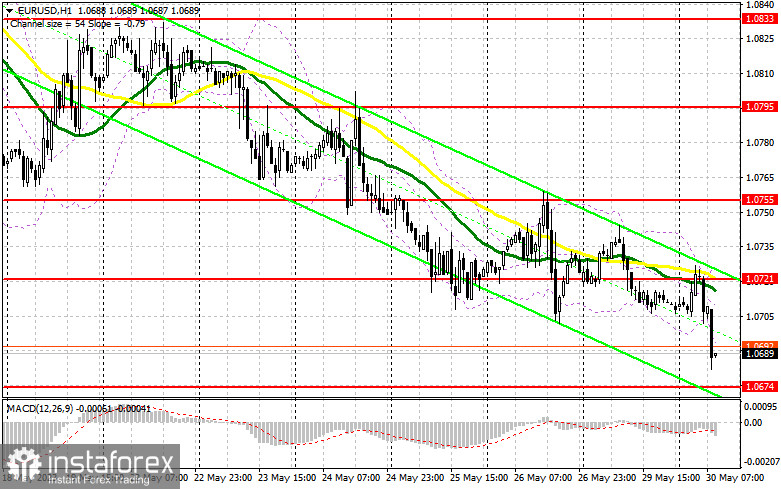
Today's macroeconomic calendar contains the following releases: eurozone M3 money supply and lending to households. The ECB is closely watching changes in lending to households. If figures come worse than expected, that may affect future GDP and the euro. In addition, if consumer confidence decreases in May, the euro will again show weakness. Therefore, I will buy only after a fall and a false breakout through the monthly low of 1.0674. If lending data come upbeat, EUR/USD will rise to 1.0721 resistance, which is in line with the bearish moving averages. An additional buy entry point with the target at 1.0755 will be created after a breakout and a downside test of this range. The most distant target is seen at 1.0795 where I will lock in profits. If there is no bullish activity at 1.0674, a bear trend may begin. A false breakout through 1.0634 support will generate a buy signal. I will open long positions from the low of 1.0595, allowing a bullish correction of 30-35 pips intraday.
When to open short positions on EUR/USD:
Sellers are in control of the market. In case of a bullish correction after the release of macro data in the eurozone, they should protect 1.0721 resistance. A false breakout through this mark will produce a sell signal, targeting the low of 1.0674. In case of consolidation below this range and its retest to the upside, the price will head toward 1.0634. The most distant target is seen at the low of 1.0595 where I will lock in profits.
If EUR/USD goes up in the European session and there is no bearish activity at 1.0721, sellers will attempt to take the market under control. Therefore, I will sell the instrument at 1.0755 after failed consolidation. I will also consider selling on a bounce from the high of 1.0795, allowing a bearish correction of 30-35 pips.
Indicator signals:
Moving averages:
Trading is carried out below the 30-day and 50-day moving averages, which indicates a bearish continuation.
Note: The period and prices of moving averages are considered by the author on the H1 (1-hour) chart and differ from the general definition of the classic daily moving averages on the daily D1 chart.
Bollinger Bands
Support stands at 1.0696, in line with the lower band. Resistance is seen at 1.0721, in line with the upper band.
Indicator description:
Dzięki analizom InstaForex zawsze będziesz na bieżące z trendami rynkowymi! Zarejestruj się w InstaForex i uzyskaj dostęp do jeszcze większej liczby bezpłatnych usług dla zyskownego handlu.

