 Anuluj
Warunki handlowe
Narzędzia


EUR/USD finally began its long-awaited decline on Thursday. Although it wasn't exceptionally strong, it's still better than the perpetual and unfounded rise of the euro. What's interesting is that the dollar did not have any substantial reasons to rise on Thursday. The US published reports on unemployment claims, retail sales, and producer prices. We would guess that the dollar strengthened particularly due to the Producer Price Index, which exceeded forecasts twice as much in February, showing an increase of 0.6% on a monthly basis. This week we witnessed two inflation reports that both showed growth instead of slowing down.
So now we obviously arrive at the conclusion that the Federal Reserve may keep the interest rate at its peak level for even longer, because why lower it if inflation isn't decreasing to the target level? It seems that this time market participants have drawn the same conclusion, which explains the dollar's strength. Also, take note that retail sales report turned out to be weaker than forecasts, but that's not crucial. Now let's hope that the pair manages to maintain the current downward momentum, instead of ending Friday with another one of the euro's illogical growth. We expect the euro to fall as low as $1.02. But first, traders need to overcome at least the Senkou Span B line.
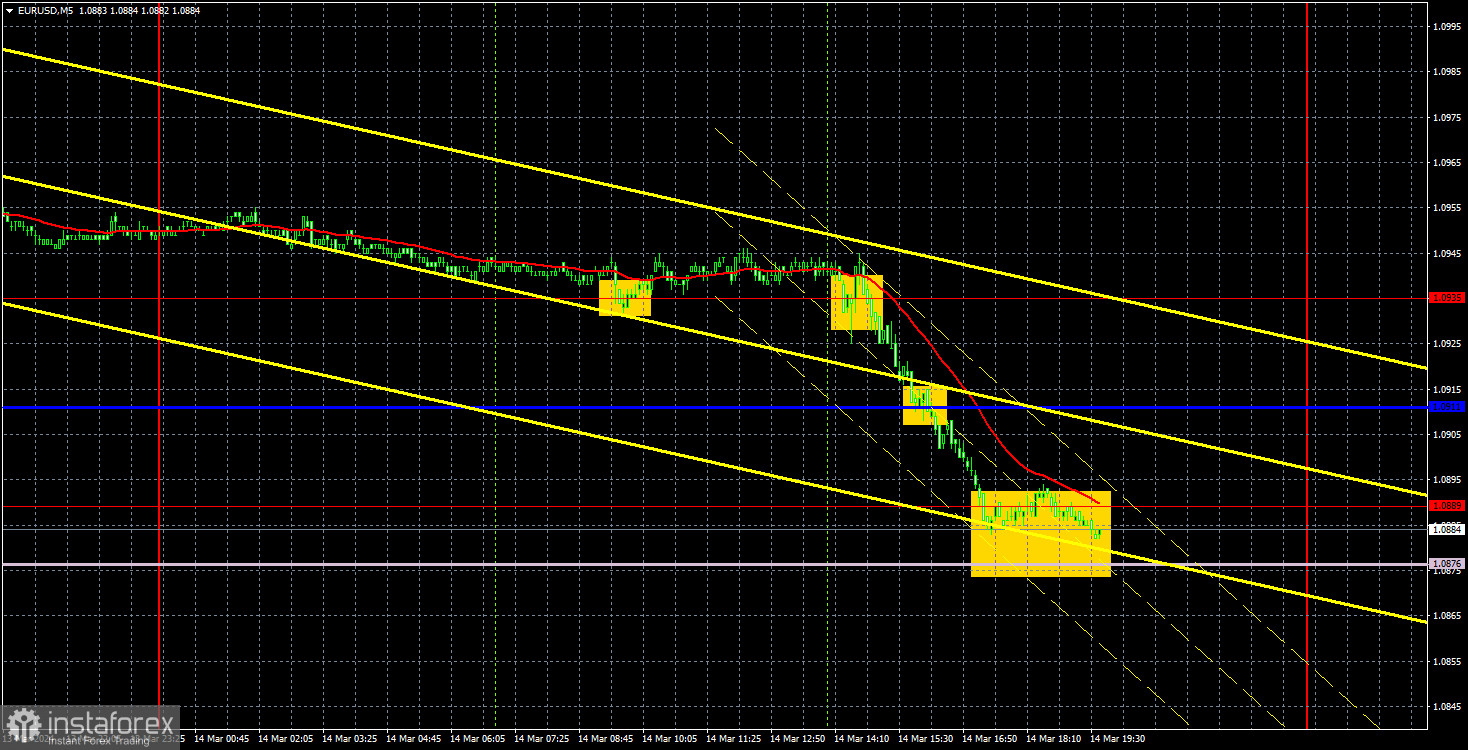
The first trading signal on Thursday turned out to be a false signal, as the price remained flat throughout the European session. However, after the US trading session opened, a sell signal was formed around the level of 1.0935. By the end of the day, the pair was between 1.0876 and 1.0889, where traders could take profit. Now they could sell the pair if it consolidates below the Senkou Span B line.
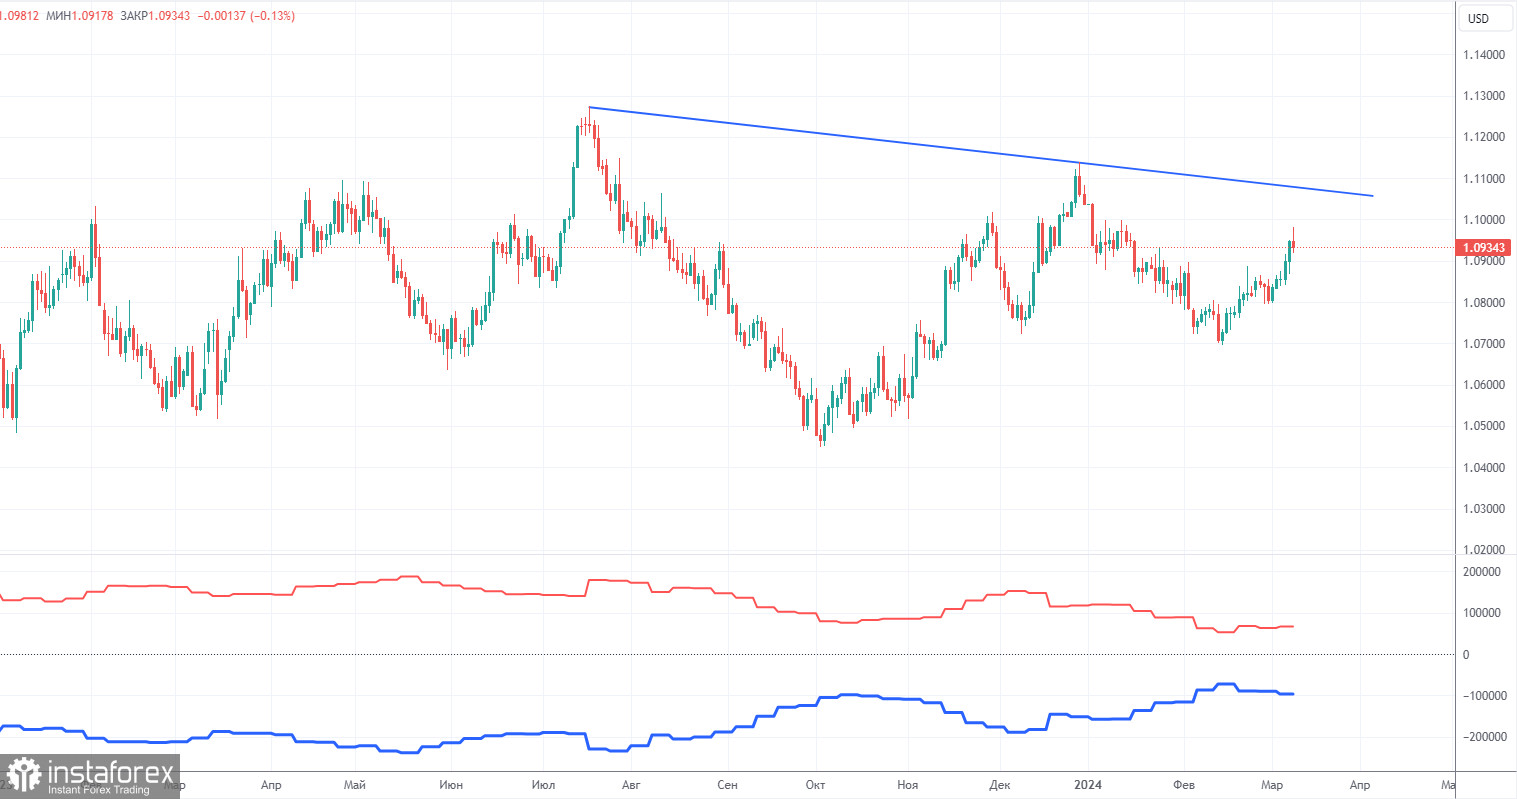
The latest COT report is dated March 5. The net position of non-commercial traders has been persistently bullish for quite some time. Basically, the number of long positions in the market is higher than the number of short positions. However, at the same time, the net position of non-commercial traders has been decreasing in recent months, while that of commercial traders has been increasing. This shows that market sentiment is turning bearish, as speculators are increasing the volume of short positions on the euro. We don't see any fundamental factors that can support the euro's growth in the long term, while technical analysis also points to the formation of a downtrend.
We have already drawn your attention to the fact that the red and blue lines have significantly diverged, often preceding the end of a trend. Currently, these lines are moving towards each other (indicating a trend reversal). Therefore, we believe that the euro will fall further. During the last reporting week, the number of long positions for the non-commercial group decreased by 5,200, while the number of short positions decreased by 8,600. Accordingly, the net position increased by 3,400, which is relatively small. The number of buy contracts is still higher than the number of sell contracts among non-commercial traders by 66,000 (previously 63,000). Thus, commercial traders continue to sell the euro.
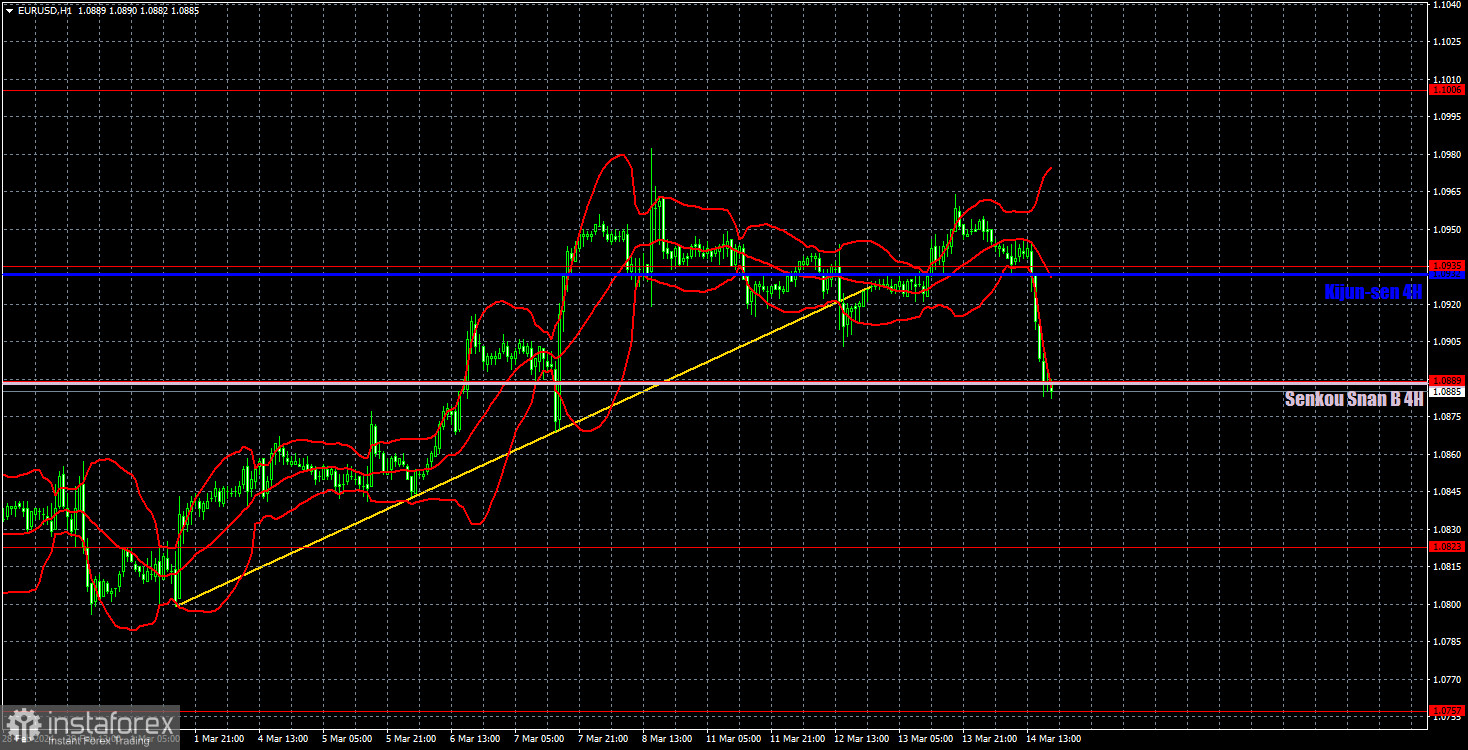
On the 1-hour chart, EUR/USD may start the long-awaited downtrend, which could take the price far down. On Friday, the lower boundary of the Ichimoku cloud - the Senkou Span B line - will be extremely important. A breakthrough will pave the way for the pair to fall further, which is what we are counting on. A bounce from this line will trigger a new surge for the euro. The bulls have not left the market yet and have not lost their motivation to buy euros out of nowhere.
On March 15, we highlight the following levels for trading: 1.0530, 1.0581, 1.0658-1.0669, 1.0757, 1.0823, 1.0889, 1.0935, 1.1006, 1.1092, as well as the Senkou Span B (1.0888) and Kijun-sen (1.0932) lines. The Ichimoku indicator lines can move during the day, so this should be taken into account when identifying trading signals. Don't forget to set a Stop Loss to breakeven if the price has moved in the intended direction by 15 pips. This will protect you against potential losses if the signal turns out to be false.
On Friday, there are no interesting events lined up in the European Union. The US docket will feature reports on industrial production and consumer sentiment from the University of Michigan. We expect a muted reaction to these reports as they are not considered crucial.
Support and resistance levels are thick red lines near which the trend may end. They do not provide trading signals;
The Kijun-sen and Senkou Span B lines are the lines of the Ichimoku indicator, plotted to the 1H timeframe from the 4H one. They provide trading signals;
Extreme levels are thin red lines from which the price bounced earlier. They provide trading signals;
Yellow lines are trend lines, trend channels, and any other technical patterns;
Indicator 1 on the COT charts is the net position size for each category of traders;
Indicator 2 on the COT charts is the net position size for the Non-commercial group.
Dzięki analizom InstaForex zawsze będziesz na bieżące z trendami rynkowymi! Zarejestruj się w InstaForex i uzyskaj dostęp do jeszcze większej liczby bezpłatnych usług dla zyskownego handlu.


