 Anuluj
Warunki handlowe
Narzędzia


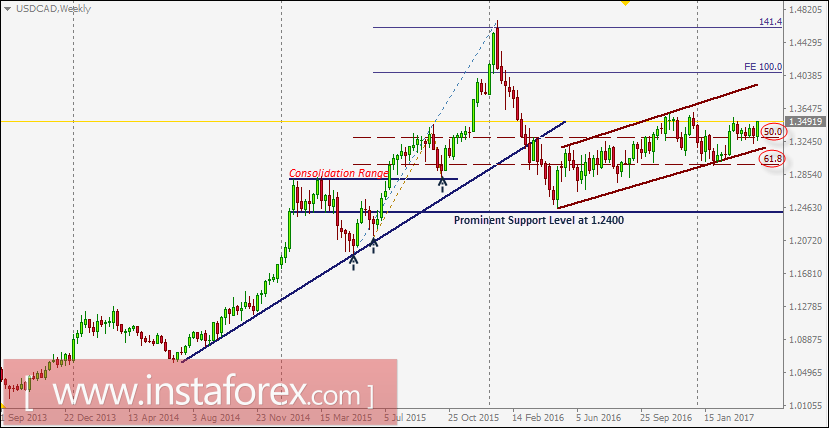
Since April 2016, the USD/CAD pair has been trending upward within the depicted ascending channel.
In December 2016, a bullish breakout above 1.3300 (50% Fibonacci level) was expected to allow a further advance toward 1.3700-1.3750 (the upper limit of the depicted channel).
However, significant bearish rejection was expressed around 1.3580 (recently established top).
During the bearish pullback, the price level of 1.3300 (50% Fibonacci Level) failed to provide enough support to the pair.
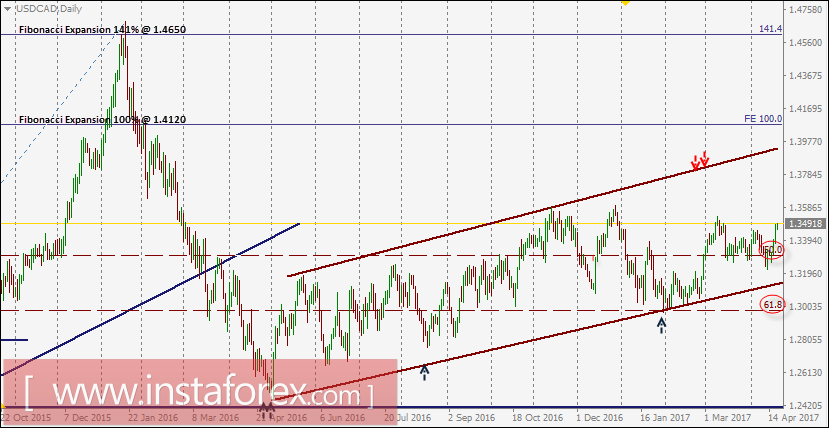
This allowed a further bearish movement toward the price level of 1.2970 (61.8% Fibonacci level) where a valid BUY entry was offered in February 2017.
Three weeks ago, the bullish breakout above 1.3300 (50% Fibonacci Level) enhanced a further advance toward 1.3440 and 1.3530.
The next bullish target would be located around 1.3800 (upper limit of the depicted channel) if the pair maintains upside trading above 1.3300 (50% Fibonacci Level) which stands as a prominent support level.
On the other hand, if the USD/CAD pair moves below 1.3300, it may become trapped again within the depicted consolidation range (1.3300-1.2970).
Dzięki analizom InstaForex zawsze będziesz na bieżące z trendami rynkowymi! Zarejestruj się w InstaForex i uzyskaj dostęp do jeszcze większej liczby bezpłatnych usług dla zyskownego handlu.


