 Anuluj
Warunki handlowe
Narzędzia


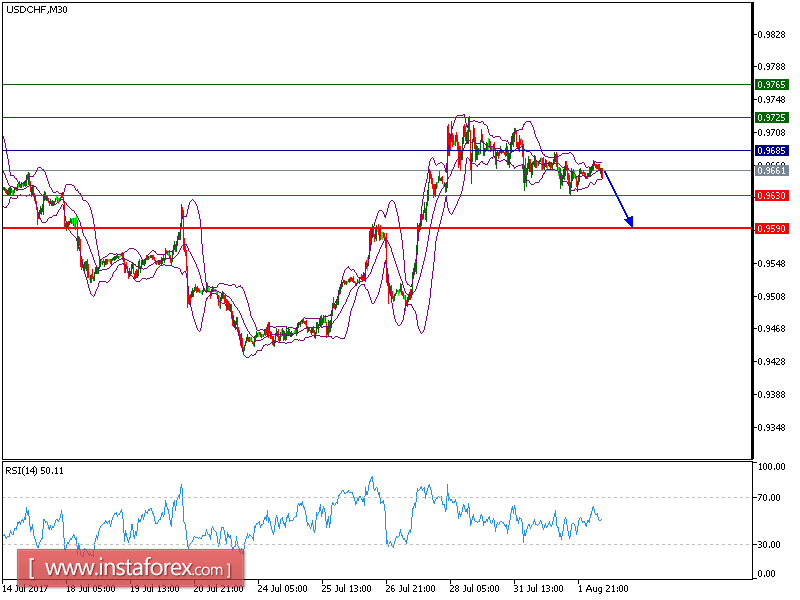
USD/CHF is expected to trade with bearish outlook and inch lower. The pair is under pressure below the key resistance at 0.9685 (the high of August 1). The declining 50-period moving average is playing a resistance role. The relative strength index is mixed with bearish bias.
The U.S. Commerce Department reported that the price index for the personal consumption expenditures, the Federal Reserve's preferred measure of inflation, was flat in June from the prior month. The Institute for Supply Management (ISM) said its manufacturing index fell to 56.3 in July from 57.8 in June. As a result, U.S. government bond strengthened, pressing the benchmark 10-year Treasury note to 2.253% from 2.292% Monday.
To sum up, as long as 0.9685 holds on the upside, we expect a further decline to 0.9630 and even to 0.9590 in extension.
Chart Explanation: The black line shows the pivot point. The present price above the pivot point indicates the bullish position and below the pivot points indicates the short position. The red lines show the support levels and the green line indicates the resistance levels. These levels can be used to enter and exit trades.
Strategy: SELL, Stop Loss: 0.9630, Take Profit: 0.9590
Resistance levels: 0.9725, 0.9765, and 0.9800
Support levels: 0.9630, 0.9590, and 0.9540
Dzięki analizom InstaForex zawsze będziesz na bieżące z trendami rynkowymi! Zarejestruj się w InstaForex i uzyskaj dostęp do jeszcze większej liczby bezpłatnych usług dla zyskownego handlu.


