 Anuluj
Warunki handlowe
Narzędzia


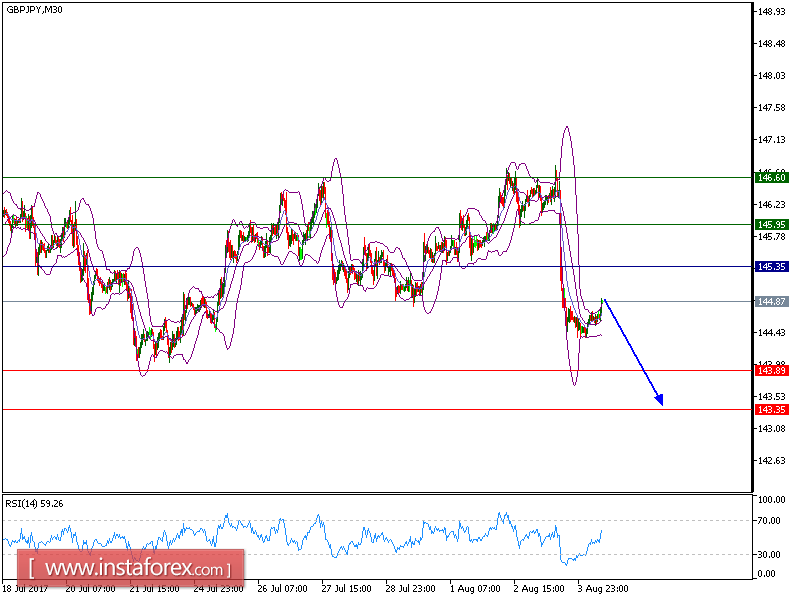
Our first target which we predicted in Yesterday's analysis has been hit. Now the pair is under pressure and expected to trade in a lower range. The pair recorded a succession of lower tops and lower bottoms, which confirms a negative view. The relative strength index is below its neutrality level at 50 and lacks upward momentum. The declining 20-period and 50-period moving averages are playing resistance roles and maintain the downside bias.
As long as 145.35 holds on the upside, look for a further drop towards 143.90 and even 143.35 in extension.
Alternatively, if the price moves in the opposite direction as predicted, a long position is recommended above 145.35 with the target at 145.95.
Strategy: SELL, Stop Loss: 145.35, Take Profit: 143.90.
Chart Explanation: the black line shows the pivot point. The price above the pivot point indicates the bullish position and when it is below the pivot points, it indicates a short position. The red lines show the support levels and the green line indicates the resistance levels. These levels can be used to enter and exit trades.
Resistance levels: 145.90, 146.60, and 147.00
Support levels: 143.90, 143.35, and 142.75.
Dzięki analizom InstaForex zawsze będziesz na bieżące z trendami rynkowymi! Zarejestruj się w InstaForex i uzyskaj dostęp do jeszcze większej liczby bezpłatnych usług dla zyskownego handlu.

