 Anuluj
Warunki handlowe
Narzędzia


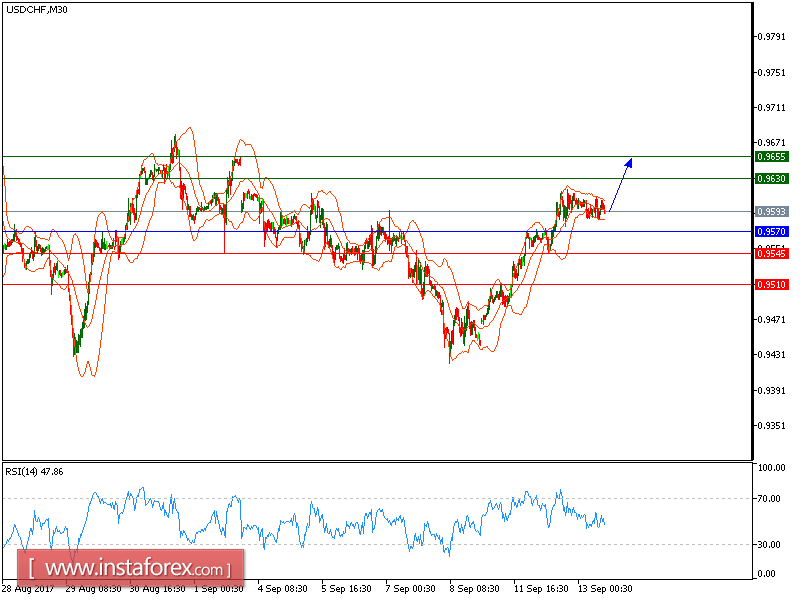
Our initial target in our previous analysis has been hit. USD/CHF is expected to continue the upside movement. The pair recorded higher tops and higher bottoms since September 8, which confirmed a positive outlook. The rising 50-period moving average suggests that the prices have potential for a further upside. The relative strength index lacks downward momentum.
US dollar gained modestly yesterday after its biggest downward rally in nearly eight months as investors are waiting for important data due to announced today.
Investors are also waiting for US inflation data due to be announced today at 12:30 GMT, it is expected that the producer price index will have increased to 0.3% in August against the -0.1% in July and Core PPI is expected to come out at 0.2% as compared to -0.1% previously.
Therefore, as long as 0.9570 is support, expect a new challenge to 0.9630 and even to 0.9655 in extension.
Chart Explanation: The black line shows the pivot point. The present price above the pivot point indicates a bullish position, and the price below the pivot points indicates a short position. The red lines show the support levels and the green line indicates the resistance levels. These levels can be used to enter and exit trades.
Strategy: BUY, Stop Loss: 0.9570, Take Profit: 0.9630
Resistance levels: 0.9630, 0.9655, and 0.9700
Support levels: 0.9545, 0.9510, and 0.9460
Dzięki analizom InstaForex zawsze będziesz na bieżące z trendami rynkowymi! Zarejestruj się w InstaForex i uzyskaj dostęp do jeszcze większej liczby bezpłatnych usług dla zyskownego handlu.


