 Stay
Stay 
Trading Conditions
Products
Tools


Gold price re-tested the important resistance of $1,283-88 but got rejected once again. Despite Dollar's weakness, Gold did not break above the resistance. This was a bearish sign. The other bearish sign we noted yesterday was the form of the rise from $1,262 that was not an impulsive, but overlapping corrective structure. This increased the chances of a reversal.
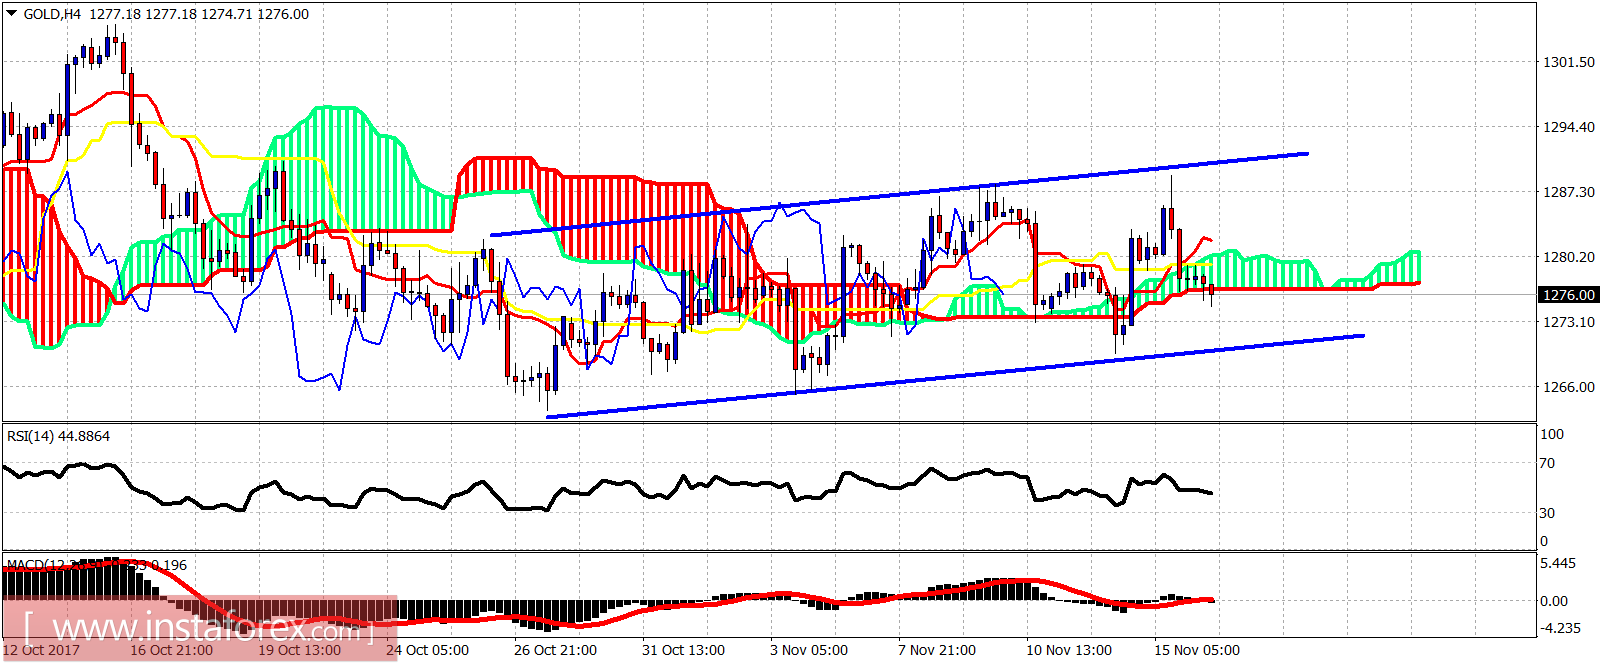
Gold price reached the upper channel boundary and got rejected. Price is now again below the 4-hour Kumo. Yesterday, we noted that despite price being above the 4-hour Kumo, trend was neutral as price was not making any progress to the upside. Price is still mainly moving sideways. If Dollar strengthens, I expect to see support at $1,262 get broken. This implies that we should fall towards $1,250-45.
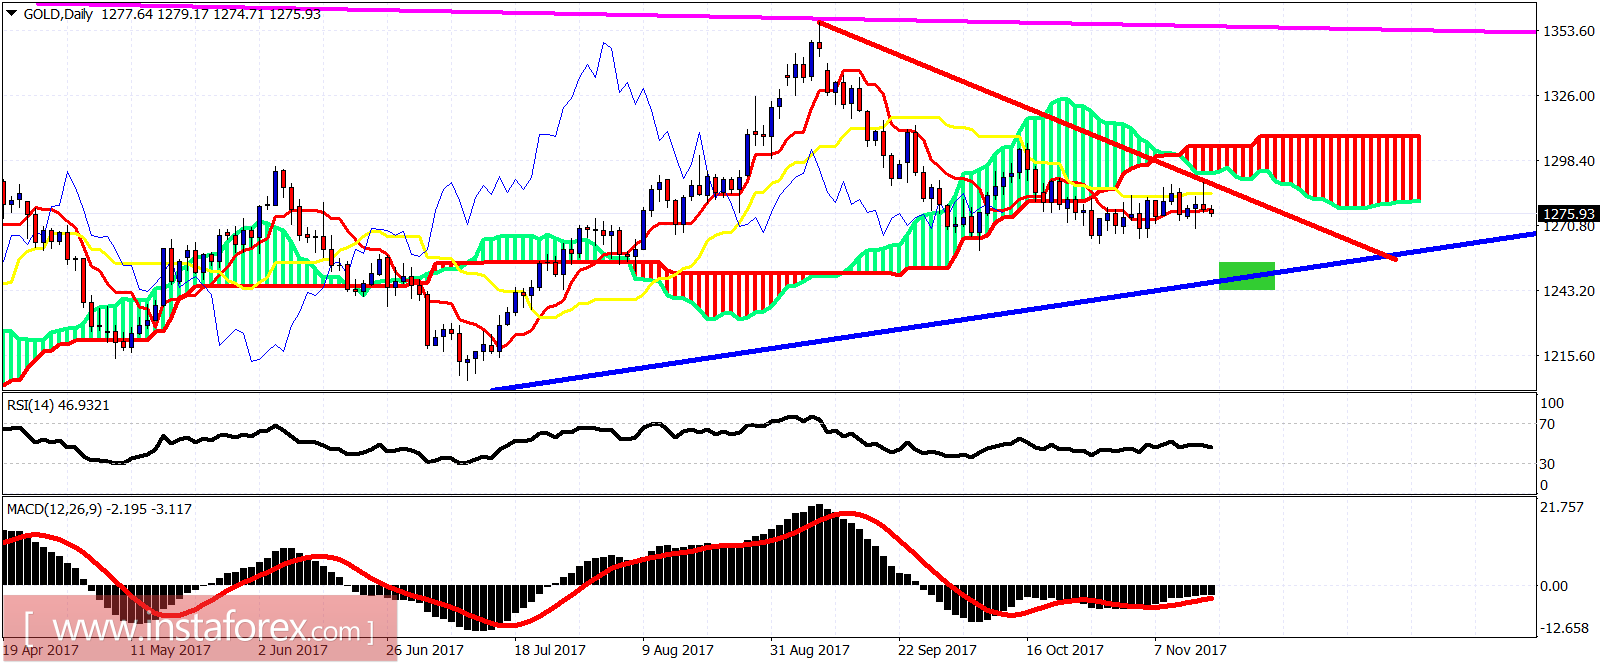
Magenta line - resistance
Red line - short-term trend line resistance
Blue line -long-term trend line support
Gold price has broken again below the tenkan-sen in the daily chart as price got rejected once again at the kijun-sen. Trend remains bearish and Gold is heading towards the blue long-term upward sloping support trend line. There we should finally see an important low in Gold.
InstaForex analytical reviews will make you fully aware of market trends! Being an InstaForex client, you are provided with a large number of free services for efficient trading.

